net2phone Launches HIPAA-Compatible Agentic AI Solution for Healthcare
Newark, NJ, Nov. 17, 2025 (GLOBE NEWSWIRE) — net2phone, a trusted provider of intelligent communications solutions, today announced the launch of its HIPAA-compatible AI Agent offering.
net2phone’s agentic AI solution empowers healthcare providers to spend more time with their patients by handling patient communications and administrative workflows with thoughtfully designed intelligence.
The HIPAA-compatible net2phone AI Agent combines advanced conversational capabilities with end-to-end security and integrates with existing database solutions for streamlined patient interactions, reduced administrative burdens, and enhanced patient satisfaction.
“Healthcare providers everywhere are challenged to manage their administrative workloads while prioritizing patient care,” said Jonah Fink, CEO at net2phone. “Our HIPAA-compatible AI Agent is here to help – efficiently automating everyday patient interactions while ensuring that every conversation and communication adheres to strict HIPAA privacy and security standards.”
Transforming Healthcare Communications
Count on net2phone’s HIPAA-compatible AI Agent to:
Provide 24/7 virtual assistance for routine inquiries;
Handle patient scheduling and reminders;
Route and triage patient communications using natural language understanding to connect patients with the right department faster; and
Securely integrate with EHR, CRM, and scheduling systems.
net2phone’s AI agent handles routine patient administrative tasks and streamlines communications to help organizations reduce operational costs, improve response times, and enable staff to focus on patient care. Clinics, hospitals, private practices, and other healthcare organizations can now leverage net2phone’s AI Agent while enjoying HIPAA compatibility in every interaction.
net2phone’s innovative AI-powered communications and task execution help businesses around the globe succeed through smarter conversations, automated workflows, and enhanced insight. net2phone’s commitment to delivering reliable and high-quality communications services has earned it a reputation as a leader in both innovation and growth. net2phone is a subsidiary of IDT Corporation (NYSE: IDT). To learn more, please visit net2phone.com or connect on LinkedIn.
IDT Corporation to Report First Quarter Fiscal Year 2026 Results
NEWARK, NJ, Nov. 14, 2025 (GLOBE NEWSWIRE) — IDT Corporation (NYSE: IDT), a global provider of fintech and communications solutions, has scheduled its report of financial and operational results for the first quarter fiscal year 2026 (the three months ended October 31, 2025) on Thursday, December 4, 2025.
IDT’s earnings release will be issued and posted on the IDT investor relations website (https://www.idt.net/investors-and-media) at approximately 4:30 PM Eastern.
IDT will host an earnings conference call beginning at 5:30 PM Eastern with management’s discussion of results followed by Q&A with investors. To listen to the call and participate in the Q&A, dial 1-888-506-0062 (toll-free from the US) or 1-973-528-0011 (international) and provide the following access code: 586702.
A replay of the conference call will be available approximately three hours after the call concludes through December 18, 2025. To access the call replay, dial 1-877-481-4010 (toll-free from the US) or 1-919-882-2331 (international) and provide this replay passcode: 53127. The replay will also be accessible via streaming audio at the IDT investor relations website.
ABOUT IDT CORPORATION IDT Corporation (NYSE: IDT) is a global provider of fintech and communications solutions through a portfolio of synergistic businesses: National Retail Solutions (NRS), through its point-of-sale (POS) platform, enables independent retailers to operate more effectively while providing advertisers and marketers with unprecedented reach into underserved consumer markets; BOSS Money facilitates innovative international remittances and fintech payments solutions; net2phone provides enterprises and organizations with intelligently integrated cloud communications and contact center services across channels and devices; IDT Digital Payments and the BOSS Revolution calling service make sharing prepaid products and services and speaking with friends and family around the world convenient and reliable; and, IDT Global and IDT Express enable communications services to provision and manage international voice and SMS messaging.
National Retail Solutions (NRS) Launches Grubhub Integration
Integration brings seamless digital ordering and delivery capabilities to NRS convenience stores, bodegas, and neighborhood retailers nationwide
Newark, NJ, Nov. 11, 2025 (GLOBE NEWSWIRE) — National Retail Solutions (NRS) announced today that independent retailers in its nationwide point-of-sale (POS) network can now offer their customers remote ordering for delivery or in-store pick-up via the Grubhub app.
“We are tremendously excited to announce our integration with Gubhub,” said Elie Y. Katz, President and CEO of NRS. “This partnership empowers our NRS retailers, which are predominantly neighborhood convenience stores and bodegas, to compete effectively and efficiently in the rapidly expanding digital channel.”
For NRS retailers, the key advantages and features of the integration with Grubhub include:
Streamlined operations: Grubhub orders flow directly into the NRS POS system, eliminating counter clutter and simplifying workflows;
Real-time menu and inventory syncing: Price updates and inventory changes that are recorded in the retailer’s NRS POS are automatically reflected on the retailer’s Grubhub menu, ensuring accurate orders while preventing out-of-stock cancellations;
Reduced training: Retailers receive and process orders through their familiar NRS POS, minimizing errors and training time;
Centralized management: Retailers can manage Grubhub menus, store hours, and analytics directly from their NRS POS; and,
Actionable analytics: Centralized analytics enable NRS retailers to gain insights into both in-store and delivery sales performance.
“Local businesses are essential to the fabric of their communities, and this integration is about helping them thrive in a digital-first world,” said Stephanie Grammel, Director of Integrations & Solutions at Grubhub. “By embedding Grubhub directly into the NRS point-of-sale system, we are making it easier for independent retailers to expand their reach, serve customers on their terms, and unlock new revenue streams-without adding operational complexity.”
“We are eliminating the friction points that make it harder for small businesses to compete successfully in the delivery marketplace,” said Ari B. Korman, SVP of Ecommerce at NRS. “Based on our results to date, on average, our retailers with the Grubhub integration are achieving significantly increased profitability with very strong ROIs.”
NRS retailers interested in learning more about the Grubhub integration can contact their NRS representative or visit nrsplus.com for more information about activation and setup.
About National Retail Solutions (NRS):
National Retail Solutions operates a leading point-of-sale (POS) terminal-based platform and digital payment processing service for independent retailers nationwide. Retailers utilize NRS offerings to process transactions and effectively manage their businesses. Consumer packaged goods (CPG) suppliers, brokers, analytics firms, and advertisers access the NRS POS terminal’s digital display network to reach these retailers’ predominantly urban, multi-cultural shopper base, and to harness transaction data-based learnings to identify growth opportunities and measure execution and returns on marketing investment. NRS is a subsidiary of IDT Corporation (NYSE: IDT).
About Grubhub:
Grubhub is a leading U.S. ordering and delivery marketplace dedicated to connecting customers with their favorite local restaurants, merchants and convenience retailers. Grubhub elevates online ordering through innovative restaurant technology, easy-to-use platforms, and an improved delivery experience. Part of Wonder, Grubhub features over 415,000 merchants in more than 4,000 U.S. cities.
All statements above that are not purely about historical facts, including, but not limited to, those in which we use the words “believe,” “anticipate,” “expect,” “plan,” “intend,” “estimate,” “target” and similar expressions, are forward-looking statements within the meaning of the Private Securities Litigation Reform Act of 1995. While these forward-looking statements represent our current judgment of what may happen in the future, actual results may differ materially from the results expressed or implied by these statements due to numerous important factors. Our filings with the SEC provide detailed information on such statements and risks, and should be consulted along with this release. To the extent permitted under applicable law, IDT assumes no obligation to update any forward-looking statements.
NRSInsights’ October 2025 Retail Same-Store Sales Report
October same-store sales increased 5.7% year-over-year
The average price paid for the top 500 items in October increased 3.0% year-over-year
NEWARK, N.J., Nov. 07, 2025 (GLOBE NEWSWIRE) — NRSInsights, a provider of sales data and analytics drawn from retail transactions processed through the National Retail Solutions (NRS) point-of-sale (POS) platform, today announced comparative retail same-store sales results for October 2025.
As of October 31, 2025, the NRS retail network comprised approximately 37,900 active terminals nationwide, scanning purchases at approximately 32,900 independent retailers, including convenience stores, bodegas, liquor stores, grocers, and tobacco and sundries sellers, predominantly serving urban consumers.
October Highlights
(Same-store sales, unit sales, transactions, and average price data refer to October 2025 and are compared to October 2024 unless otherwise noted. All comparisons are provided on a “per calendar day” basis to remove from consideration variability in the number of days per month or three-month period.)
SALES
Same-store sales increased 5.7% year-over-year. In the previous month (September 2025), same-store sales increased 5.8% year-over-year.
Same-store sales decreased 0.7% compared to the previous month (September 2025). Same-store sales in September 2025 decreased 2.5% compared to the previous month (August 2025).
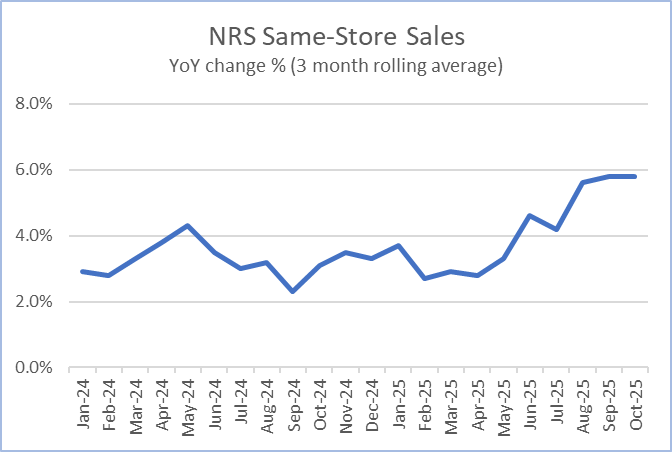
For the three months ended October 31, 2025, same-store sales increased 5.8% compared to the corresponding three months a year ago.
UNITS SOLD
Units sold increased 1.3% year-over-year. In the previous month (September 2025), units sold increased 2.5% year-over-year.
Units sold decreased 1.8% compared to the previous month (September 2025). Units sold in September 2025 decreased 1.1% compared to the previous month (August 2025).
BASKETS (TRANSACTIONS) PER STORE
Baskets increased a slight 0.1% year-over-year. In the previous month (September 2025), baskets increased 1.9% year-over-year.
Baskets decreased 2.6% compared to the previous month (September 2025). Baskets in September 2025 decreased 1.1% compared to the previous month (August 2025).
AVERAGE PRICES
A dollar-weighted average of prices for the top 500 items purchased in October increased 3.0% year-over-year, a slight increase from the 2.9% year-over-year increase in September 2025.
Retail Trade Comparative Data
Current U.S. Commerce Department’s Advance Monthly Retail Trade same-store sales data excluding food service is unavailable during the government shutdown.
Commentary from Brandon Thurber (VP, Data Sales & Client Success at NRS)
“October was another strong month for independent retail, with dollar sales climbing 5.7% and units up slightly even as transactions remained stable. Year-over-year growth was led by cigarettes, prepared cocktails, smokeless tobacco, energy beverages, and wine-based cocktails, while month-over-month gains were strongest in cigarettes, soft drinks, whiskey, confection, and tequila.”
“Over the past four months, the average rate of price increase for the best-selling items on our network has held in a narrow range of 2.9% to 3% range.
“Overall, the data signals healthy consumer engagement heading into the holidays – and we expect to see notable expansion in high-velocity categories such as beverages, confection, and tobacco alternatives as demand builds toward the holiday season.”
NRSInsights Reports
The NRSInsights monthly Same-Store Retail Sales Reports are intended to provide timely topline data reflective of sales at NRS’ network of independent, predominantly urban, retail stores.
Same-store data comparisons of October 2025 with October 2024 are derived from approximately 229 million transactions processed through the approximately 23,800 stores on the NRS network that scanned transactions in both months. Same-store data comparisons of October 2025 with September 2025 are derived from approximately 280 million transactions processed through approximately 31,700 stores.
Same-store data comparisons for the three months ended October 31, 2025 with the year-ago three months are derived from approximately 666 million scanned transactions processed through those stores that scanned transactions in both three-month periods.
NRS POS Platform
The NRS platform predominantly serves small-format, independent, retail stores nationwide including convenience stores, bodegas, liquor stores, grocers, and tobacco and sundries sellers. These independent retailers operate in all 50 states and the District of Colombia, including 205 of the 210 designated market areas (DMAs) in the United States, and in Canada. During October 2025, NRS’ POS terminals processed $2.15 billion in sales (+17% year-over-year) across 184 million transactions.
About National Retail Solutions (NRS):
National Retail Solutions operates a leading point-of-sale (POS) terminal-based platform and digital payment processing service for independent retailers nationwide. Retailers utilize NRS offerings to process transactions and effectively manage their businesses. Consumer packaged goods (CPG) suppliers, brokers, analytics firms, and advertisers access the terminal’s digital display network to reach these retailers’ predominantly urban, multi-cultural shopper base, and to harness transaction data-based learnings to identify growth opportunities and measure execution and returns on marketing investment. NRS is a subsidiary of IDT Corporation (NYSE: IDT).
All statements above that are not purely about historical facts, including, but not limited to, those in which we use the words “believe,” “anticipate,” “expect,” “plan,” “intend,” “estimate,” “target” and similar expressions, are forward-looking statements within the meaning of the Private Securities Litigation Reform Act of 1995. While these forward-looking statements represent our current judgment of what may happen in the future, actual results may differ materially from the results expressed or implied by these statements due to numerous important factors. Our filings with the SEC provide detailed information on such statements and risks, and should be consulted along with this release. To the extent permitted under applicable law, IDT assumes no obligation to update any forward-looking statements.
NRSInsights Contact: Brandon Thurber VP, Data Sales & Client Success at NRS National Retail Solutions Brandon.Thurber@nrsplus.com
NRSInsights’ September 2025 Retail Same-Store Sales Report
September same-store sales increased 5.8% year-over-year The average price paid for the top 500 items in August increased 2.9% year-over-year
NEWARK, N.J., Oct. 06, 2025 (GLOBE NEWSWIRE) — NRSInsights, a provider of sales data and analytics drawn from retail transactions processed through the National Retail Solutions (NRS) point-of-sale (POS) platform, today announced comparative retail same-store sales results for September 2025.
As of September 30, 2025, the NRS retail network comprised approximately 37,400 active terminals nationwide, scanning purchases at approximately 32,400 independent retailers, including convenience stores, bodegas, liquor stores, grocers, and tobacco and sundries sellers, predominantly serving urban consumers.
September Highlights
(Same-store sales, unit sales, transactions, and average price data refer to September 2025 and are compared to September 2024 unless otherwise noted. All comparisons are provided on a “per calendar day” basis to remove from consideration variability in the number of days per month or three-month period.)
SALES
Same-store sales increased 5.8% year-over-year. In the previous month (August 2025), same-store sales increased 8.3% year-over-year.
Same-store sales decreased 2.5% compared to the previous month (August 2025). Same-store sales in August 2025 increased 3.4% compared to the previous month (July 2025).
For the three months ended September 30, 2025, same-store sales increased 5.8% compared to the corresponding three months a year ago.
UNITS SOLD
Units sold increased 2.5% year-over-year. In the previous month (August 2025), units sold increased 4.3% year-over-year.
Units sold decreased 1.1% compared to the previous month (August 2025). Units sold in August 2025 increased 1.8% compared to the previous month (July 2025).
BASKETS (TRANSACTIONS) PER STORE
Baskets increased 1.9% year-over-year. In the previous month (August 2025), baskets increased 2.6% year-over-year.
Baskets decreased 1.1% compared to the previous month (August 2025). Baskets in August 2025 increased 2.2% compared to the previous month (July 2025).
AVERAGE PRICES
A dollar-weighted average of prices for the top 500 items purchased increased 2.9% year-over-year, a lower rate of increase than the 3.0% year-over-year increase recorded in August 2025.
Retail Trade Comparative Data
The table below provides historical comparative data with the U.S. Commerce Department’s Advance Monthly Retail Trade same-store sales data excluding food service:
Over the past twelve months through August 2025, the US Commerce Department’s Advance Monthly Retail Trade data, excluding food services, outpaced the NRS network’s three-month moving average same-store sales by 0.1% on average. In August, the NRS network’s three-month rolling average increase exceeded the US Commerce Department’s by 1.4%.
The NRSInsights data in the chart above have not been adjusted to reflect inflation, demographic distributions, seasonal buying patterns, item substitution, days per month, or other factors that may facilitate comparisons to other periods, to other same-store retail sales data, or to the U.S. Commerce Department’s retail data.
Commentary from Brandon Thurber (VP, Data Sales & Client Success at NRS)
“NRS retailers delivered another month of strong year-over-year sales increases across both beverage and center-store categories in September, while the sequential sales decrease was inline with expectations following the peak summer months. The three month rolling average increase, also 5.8%, is the most since 2023.
“Growth was led by prepared cocktails and sparkling water, which continue to capture consumer attention with premium positioning. Coffee also stood out as a beverage momentum driver.
“Retailers also experienced a lift from cold and flu remedies in September. The early strength in these seasonal offerings in combination with increases across indulgent categories reflect the diversity of the modern convenience store’s offerings, and the resilience of consumer spending as we approach the holiday season.”
NRSInsights Reports
The NRSInsights monthly Same-Store Retail Sales Reports are intended to provide timely topline data reflective of sales at NRS’ network of independent, predominantly urban, retail stores.
Same-store data comparisons of September 2025 with September 2024 are derived from approximately 224 million transactions processed through the approximately 23,400 stores on the NRS network that scanned transactions in both months. Same-store data comparisons of September 2025 with August 2025 are derived from approximately 284 million transactions processed through approximately 31,400 stores.
Same-store data comparisons for the three months ended September 30, 2025 with the year-ago three months are derived from approximately 662 million scanned transactions processed through those stores that scanned transactions in both three-month periods.
NRS POS Platform
The NRS platform predominantly serves small-format, independent, retail stores nationwide including convenience stores, bodegas, liquor stores, grocers, and tobacco and sundries sellers. These independent retailers operate in all 50 states and the District of Colombia, including 205 of the 210 designated market areas (DMAs) in the United States, and in Canada. During September 2025, NRS’ POS terminals processed $2.1 billion in sales (+17% year-over-year) across 143 million transactions.
About National Retail Solutions (NRS):
National Retail Solutions operates a leading point-of-sale (POS) terminal-based platform and digital payment processing service for independent retailers nationwide. Retailers utilize NRS offerings to process transactions and effectively manage their businesses. Consumer packaged goods (CPG) suppliers, brokers, analytics firms, and advertisers access the terminal’s digital display network to reach these retailers’ predominantly urban, multi-cultural shopper base, and to harness transaction data-based learnings to identify growth opportunities and measure execution and returns on marketing investment. NRS is a subsidiary of IDT Corporation (NYSE: IDT).
All statements above that are not purely about historical facts, including, but not limited to, those in which we use the words “believe,” “anticipate,” “expect,” “plan,” “intend,” “estimate,” “target” and similar expressions, are forward-looking statements within the meaning of the Private Securities Litigation Reform Act of 1995. While these forward-looking statements represent our current judgment of what may happen in the future, actual results may differ materially from the results expressed or implied by these statements due to numerous important factors. Our filings with the SEC provide detailed information on such statements and risks, and should be consulted along with this release. To the extent permitted under applicable law, IDT assumes no obligation to update any forward-looking statements.
NRSInsights Contact: Brandon Thurber VP, Data Sales & Client Success at NRS National Retail Solutions Brandon.Thurber@nrsplus.com
IDT Corporation Reports Fourth Quarter and Fiscal Year 2025 Results
4Q25 Gross Profit +12% to $114 million; FY 2025 Gross Profit +14% to $446 million
4Q25 Income from Operations +9% to $22 million; Adjusted EBITDA +33% to $33 million
FY 2025 Income from Operations +55% to $100 million; Adjusted EBITDA +43% to $129 million, an IDT record
4Q25 EPS of $0.67 and Non-GAAP EPS of $0.76; FY 2025 EPS of $3.01 and Non-GAAP EPS of $3.19
NEWARK, NJ, Sept. 29, 2025 (GLOBE NEWSWIRE) — IDT Corporation (NYSE: IDT), a global provider of fintech and communications solutions, today reported results for its fourth quarter and full fiscal year 2025, the three and twelve months ended July 31, 2025.
4Q25 HIGHLIGHTS
Throughout this release, unless otherwise noted, results for the fourth quarter of fiscal year 2025 (4Q25) are compared to the fourth quarter of fiscal year 2024 (4Q24) and results for FY 2025 are compared to FY 2024. All earnings per share (EPS) and other ‘per share’ results are per diluted share.
Key Businesses / Segments
NRS
Recurring revenue: +22% to $32.6 million;
Income from operations: (3)% to $5.8 million;
Adjusted EBITDA: +32% to $9.3 million;
‘Rule of 40’ score: 49;
BOSS Money / Fintech segment
BOSS Money digital revenue: +31% to $27.6 million;
BOSS Money total revenue: +21% to $38.2 million;
Fintech segment income from operations: +88% to $4.8 million;
Fintech segment Adjusted EBITDA: +267% to $5.5 million;
net2phone
Subscription revenue: +8% to $22.2 million (+9% on a constant currency basis);
Income from operations: +74% to $1.5 million;
Adjusted EBITDA: +42% to $3.5 million;
Traditional Communications
Gross profit: +2% to $41.0 million;
Income from operations: +11% to $15.4 million;
Adjusted EBITDA: +8% to $17.6 million;
IDT Consolidated
Revenue: +3% to $316.6 million;
Gross profit / margin: +12% to $114.5 million / +310 bps to 36.2%;
Income from operations: +9% to $21.9 million;
Net income attributable to IDT: Decreased to $16.9 million from $36.8 million. In 4Q24, IDT realized a $23.6 million income tax benefit;
GAAP EPS: Decreased to $0.67 from $1.45;
Non-GAAP EPS: Increased to $0.76 from $0.57;
Adjusted EBITDA: +33% to $33.4 million.
FY 2025 HIGHLIGHTS
Key Businesses / Segments
NRS
Recurring revenue: +27% to $122.6 million;
Income from operations: +28% to $27.8 million;
Adjusted EBITDA: +37% to $34.2 million;
BOSS Money / Fintech Segment
BOSS Money digital revenue: +36% to $99.0 million;
BOSS Money total revenue: +29% to $139.8 million;
Fintech Segment income from operations: Increased to $15.4 million from a loss from operations of $0.1 million;
Fintech Segment Adjusted EBITDA: Increased to $18.4 million from $1.1 million;
net2phone
Subscription revenue: +9% to $85.7 million (+12% on a constant currency basis);
Income from operations: Increased 194% to $4.9 million;
Adjusted EBITDA: Increased 54% to $12.1 million;
Traditional Communications
Gross profit: +2% to $168.9 million;
Income from operations: +18% to $66.5 million
Adjusted EBITDA: +13% to $75.0 million
IDT Consolidated:
Revenue: +2% to $1,231.5 million;
Gross profit / margin: +14% to $446.2 million / +380 bps to 36.2%;
Income from operations: +55% to $100.4 million;
Net income attributable to IDT: +18% to $76.1 million. In FY 2024, IDT realized a $23.6 million income tax benefit;
GAAP EPS: Increased to $3.01 from $2.54;
Non-GAAP EPS: Increased to $3.19 from $1.95;
Adjusted EBITDA: +43% to $128.7 million, the highest fiscal year level in IDT history;
Share Repurchases: 221,823 shares of IDT Class B common stock in market transactions for $10.1 million.
(This release discloses certain Non-GAAP financial measures [Adjusted EBITDA, Non-GAAP EPS, NRS ‘Rule of 40,’ and adjusted net cash provided by operating activities] as well as certain Key Performance Metrics [net2phone subscription revenue, netphone constant currency subscription revenue growth rate, NRS Monthly Average Recurring Revenue, and BOSS Money transactions and digital channel send volume.] Please see the explanations of those measures and metrics, the reasons for their inclusion and reconciliations of non-GAAP measures to their closest GAAP measures at the end of this release.)
REMARKS BY SHMUEL JONAS, CEO
IDT’s fourth quarter capped off a strong fiscal year, highlighted by full-year double-digit Adjusted EBITDA expansion at each of our operating segments, combining to drive a 43% increase in consolidated Adjusted EBITDA to a record $129 million.
At NRS, Merchant Services and SaaS Fees revenue drove the topline growth, while NRS’ operating leverage contributed to net margin expansion. In fiscal 2026, we expect that Merchant Services and SaaS fee revenues will again drive increases in revenue per terminal and Adjusted EBITDA.
BOSS Money’s fourth quarter and full year results reflected strong digital channel expansion, which is now contributing over 80% of our remittance volume. The ongoing, industry-wide, customer led migration from retail to digital provides a large opportunity, and in the year ahead we expect to continue building market share by cross-marketing within the larger BOSS eco-system while expanding our reach through our integration with WhatsApp and deployment of a cross-border digital wallet.
At net2phone, we are excited by the potential we see in the marketplace of AI agentic offerings and the progress we have made to date in developing and deploying solutions. Already, approximately 1 in 10 of our sales conversations includes an AI agent. In fiscal 2026, we will focus on building out net2phone AI Agent and Coach, our data-driven AI coaching agent, and deploying tailored solutions for specific industry verticals and other opportunities. With this investment, we believe that by year end, 30% or more of our sales will include one or both of our AI solutions, even as we continue to steadily expand our base of UCaaS and CCaaS customers.
Across IDT, we expect to build on the considerable progress we made during fiscal 2025, with topline growth and stronger cash generation. In all our markets, consumer attitudes, government policy and/or technology are driving rapid change, and we are working hard to capitalize on the exciting opportunities in each of our growth businesses. Backed by the cash on our balance sheet and strengthening financial performance, we will continue to invest in new growth initiatives, evaluate potential bolt-on acquisitions and investments, and return cash to our stockholders through opportunistic buybacks and our quarterly dividend.
4Q25 AND FY 2025 RESULTS BY SEGMENT
National Retail Solutions (NRS)
National Retail Solutions (NRS) (Terminals and accounts at end of period. $ in millions, except for revenue per terminal)
4Q25
3Q25
4Q24
4Q25-4Q24 (% Δ)
FY25
FY24
FY25-FY24 (% Δ)
Terminals and payment processing accounts
Active POS terminals
37,200
35,600
32,100
5,100
Payment processing accounts
26,500
25,500
21,300
5,200
Recurring revenue
Merchant Services & Other
$
21.8
$
19.7
$
16.2
+34
%
$
76.8
$
54.5
+41
%
Advertising and Data
$
6.8
$
5.9
$
7.4
(8
)%
$
31.1
$
31.2
(0.3
)%
SaaS Fees
$
4.1
$
3.9
$
3.1
+33
%
$
14.7
$
11.2
+32
%
Total recurring revenue
$
32.6
$
29.4
$
26.7
+22
%
$
122.6
$
96.9
+27
%
POS Terminal Sales
$
1.7
$
1.7
$
1.6
+8
%
$
6.2
$
6.3
(1
)%
Total revenue
$
34.3
$
31.1
$
28.2
+22
%
$
128.8
$
103.1
+25
%
Monthly average recurring revenue per terminal
$
299
$
279
$
285
+5
%
$
295
$
279
+6
%
Gross profit
$
30.5
$
28.4
$
26.1
+17
%
$
116.9
$
91.5
+28
%
Gross profit margin
89
%
91
%
93
%
(370) bps
91
%
89
%
+200 bps
Technology & development
$
2.3
$
2.3
$
1.8
+29
%
$
8.7
$
7.1
+23
%
SG&A
$
20.0
$
20.0
$
18.2
+10
%
$
78.0
$
62.7
+25
%
Income from operations
$
5.8
$
6.2
$
6.0
(3
)%
$
27.8
$
21.6
+28
%
Adjusted EBITDA
$
9.3
$
7.2
$
7.1
+32
%
$
34.2
$
25.0
+37
%
CapEx
$
1.3
$
1.9
$
1.1
+15
%
$
5.4
$
3.6
+49
%
NRS Take-Aways
NRS added approximately 1,500 net active terminals and approximately 1,000 net payment processing accounts during 4Q25, including some seasonal customers expected to no longer be active in 1Q26. In FY 2025, NRS added approximately 5,100 net active terminals compared to 6,400 added in FY 2024. Although gross terminal additions increased, such growth was offset by an increase in the rate of churn of NRS’ growing customer base. NRS is working to address churn using AI for churn prediction, a new retention team, enhanced service levels, and new features to improve retailers’ bottom-lines.
NRS’ recently launched partnership with DoorDash is generating increased order volumes for early-adopting liquor stores in the NRS network. NRS is continuing to sign up other delivery providers to further strengthen this channel.
NRS Insights, NRS’ data and analytics business, has signed an agreement with one of the leading coupon providers in the U.S. The agreement will enable NRS retailers to offer and promote digital coupons to their customers once the agreement goes operational in CY 2026. NRS Insights‘ brand partners will gain a new channel for engaging with NRS’ consumers, while NRS Insights will gain a revenue and profit driver.
BOSS Money and Fintech Segment
BOSS Money and Fintech Segment (Transactions in millions. $ in millions except for revenue per transaction)
4Q25
3Q25
4Q24
4Q25-4Q24 (% Δ, $)
FY25
FY24
FY25-FY24 (% Δ, $)
BOSS Money Transactions
6.6
6.0
5.4
+22
%
23.9
18.3
+30
%
Digital channel
5.5
5.0
4.3
+28
%
19.6
14.6
+34
%
Retail channel
1.1
1.0
1.1
0
%
4.2
3.7
+14
%
Fintech Revenue
BOSS Money
$
38.2
$
34.4
$
31.5
+21
%
$
139.8
$
108.3
+29
%
Digital channel
$
27.6
$
24.5
$
21.1
+31
%
$
99.0
$
73.0
+36
%
Retail channel
$
10.6
$
9.9
$
10.4
+2
%
$
40.9
$
35.3
+16
%
Other
$
3.9
$
4.2
$
3.2
+21
%
$
14.8
$
12.4
+19
%
Total Revenue
$
42.1
$
38.6
$
34.6
+21
%
$
154.6
$
120.7
+28
%
Average BOSS Money revenue per transaction
$
5.81
$
5.74
$
5.84
(0.5
)%
$
5.85
$
5.91
(0.9
)%
Gross profit
$
24.9
$
22.6
$
19.1
+30
%
$
90.7
$
67.3
+35
%
Gross profit margin
59.1
%
58.5
%
55.2
%
390 bps
58.7
%
55.8
%
290 bps
Technology & development
$
2.3
$
2.2
$
2.4
(7
)%
$
9.1
$
9.5
(5
)%
SG&A
$
17.8
$
16.0
$
15.9
+12
%
$
66.2
$
59.6
11
%
Income (loss) from operations
$
4.8
$
4.3
$
2.5
+88
%
$
15.4
$
(0.1
)
+$15.5
Adjusted EBITDA
$
5.5
$
5.0
$
1.5
+267
%
$
18.4
$
1.1
+1,650
%
CapEx
$
0.8
$
0.8
$
0.9
(14
)%
$
3.5
$
3.6
(4
)%
BOSS Money and Fintech Take-Aways:
Digital channel send volume, namely, the amount of principal transferred by BOSS Money customers using the BOSS Money and BOSS Revolution apps, increased by over 40% in 4Q25 and FY 2025, reflecting the increases in transaction volumes and in average dollars sent per transaction. BOSS Money is adjusting its pricing models to capture accretive upside from this trend.
The Fintech segment’s robust income from operations and Adjusted EBITDA growth in 4Q25 and FY 2025 primarily reflect BOSS Money transaction growth, coupled with improved operating leverage as BOSS Money continues to decrease its unit payout and operating costs.
After achieving the highest average app store rating of the eighteen digital money transfer providers surveyed by FXC Intelligence in its 2025 customer satisfaction ranking, BOSS Money is extending its reach and further enhancing the user experience through an integration with WhatsApp, meeting customers on the dominant channel for cross border communications. The integration, which will launch in the coming weeks, will enable customers to query BOSS Money’s AI agent about destinations and rates, seamlessly initiate money transfers, and check on status of transfers, all from within WhatsApp.
net2phone
net2phone (Seats in thousands at end of period. $ in millions)
4Q25
3Q25
4Q24
4Q25-4Q24 (% Δ, $)
FY25
FY24
FY25-FY24 (% Δ, $)
Seats
422
415
396
+6
%
Revenue
Subscription revenue
$
22.2
$
21.5
$
20.5
+8
%
$
85.7
$
78.4
+9
%
Other revenue
$
0.5
$
0.5
$
0.9
(36
)%
$
2.1
$
4.0
(46
)%
Total Revenue
$
22.8
$
22.0
$
21.4
+7
%
$
87.9
$
82.3
+7
%
Gross profit
$
18.1
$
17.5
$
16.8
+8
%
$
69.7
$
65.1
+7
%
Gross profit margin
79.5
%
79.6
%
78.8
%
+70 bps
79.3
%
79.1
%
+20 bps
Technology & development
$
3.0
$
2.9
$
2.8
+7
%
$
11.7
$
10.8
+8
%
SG&A
$
13.3
$
13.0
$
13.1
+1
%
$
52.4
$
52.6
(0.4
)%
Income from operations
$
1.5
$
1.4
$
0.8
+74
%
$
4.9
$
1.7
+194
%
Adjusted EBITDA
$
3.5
$
3.2
$
2.5
+42
%
$
12.1
$
7.9
+54
%
CapEx
$
1.7
$
1.4
$
1.7
+5
%
$
6.6
$
6.3
+4
%
net2phone Take-Aways:
Subscription revenue increased by 8% in 4Q25 and by 9% in FY 2025. These increases were tempered by the FX impact of a strengthened U.S. dollar versus local currencies in Latin America. On a constant currency basis, subscription revenue increased by 9% in 4Q25 and by 12% in FY 2025, higher than the rate of seat growth, as net2phone focuses on driving expansion of average revenue per customer.
net2phone’s AI Agent, named a 2025 AI Agent Product of the Year Award winner by TMCnet, is earning strong praise from customers. net2phone’s AI agents are scalable and cost-effective solutions for automating routine operations across sales, support, and administrative functions.
In fiscal 2026, net2phone will focus on the continued development of its AI coaching agent, Coach, and deployment of customized capabilities for specific market verticals and opportunities. Solutions for the medical and hospitality markets will be among the early releases.
Traditional Communications
Traditional Communications ($ in millions)
4Q25
3Q25
4Q24
4Q25-4Q24 (% Δ)
FY25
FY24
FY25-FY24 (% Δ)
Revenue
IDT Digital Payments
$
107.0
$
102.6
$
106.1
+0.8
%
$
416.3
$
407.4
+2
%
BOSS Revolution
$
49.3
$
51.7
$
62.2
(21
)%
$
211.2
$
263.2
(20
)%
IDT Global
$
55.9
$
50.0
$
50.3
+11
%
$
209.6
$
201.1
+4
%
Other
$
5.3
$
5.8
$
6.0
(13
)%
$
23.1
$
27.8
(16.9
)%
Total Revenue
$
217.4
$
210.2
$
224.6
(3
)%
$
860.2
$
899.6
(4
)%
Gross profit
$
41.0
$
43.4
$
40.1
+2
%
$
168.9
$
166.2
+2
%
Gross profit margin
18.8
%
20.7
%
17.9
%
+90 bps
19.6
%
18.5
%
+110 bps
Technology & development
$
5.3
$
5.4
$
5.5
(5
)%
$
21.5
$
23.2
(7
)%
SG&A
$
19.9
$
20.5
$
20.2
(1
)%
$
79.9
$
84.9
(6
)%
Income from operations
$
15.4
$
17.3
$
13.9
+11
%
$
66.5
$
56.4
+18
%
Adjusted EBITDA
$
17.6
$
19.3
$
16.3
+8
%
$
75.0
$
66.3
+13
%
CapEx
$
1.4
$
1.3
$
1.6
(11
)%
$
5.3
$
5.3
(1
)%
Traditional Communications Take-Aways:
IDT Digital Payments has launched an eSim digital catalog through its Zendit prepaid platform and in the BOSS Revolution app, thus expanding its large and diversified catalog of prepaid offerings. The eSim catalog targets the large and rapidly growing travel data roaming market, offering over 5,000 plans in 190+ countries.
In FY 2026, IDT Digital Payments and BOSS Revolution (international prepaid voice calling) will continue to migrate their retail channel customers to its higher margin digital channel. The benefit of this rotation will partially offset the impact of the expected, structural decline in BOSS Revolution and IDT Global carrier revenues.
OTHER FINANCIAL RESULTS
Consolidated results for all periods presented include corporate overhead. Corporate G&A expense increased to $2.5 million in 4Q25 from $2.2 million in 4Q24. In FY 2025, corporate G&A expense increased to $11.1 million from $10.5 million in FY 2024.
As of July 31, 2025, IDT held $253.8 million in cash, cash equivalents, debt securities, and current equity investments. Also at July 31, 2025, current assets totaled $520.3 million and current liabilities totaled $293.0 million. The Company had no outstanding debt at the quarter end.
Net cash provided by operating activities in 4Q25 increased to $31.0 million from $25.4 million in 4Q24. Exclusive of changes in customer funds deposits at IDT’s Fintech segment, adjusted net cash provided by operating activities in 4Q25 increased to $37.1 million from $28.5 million in 4Q24.
In FY 2025, net cash provided by operating activities increased to $127.1 million from $78.2 million in FY 2024. Exclusive of changes in customer funds deposits at IDT’s Fintech segment, adjusted net cash provided by operating activities in FY 2025 increased to $107.8 million from $80.0 million in FY 2024.
Capital expenditures were $5.3 million in both 4Q25 and 4Q24. For FY 2025, capital expenditures increased to $20.8 million from $18.9 million in FY 2024.
FY 2026 FINANCIAL OUTLOOK
Effective with IDT’s fiscal 1Q26, the Company will revise its non-GAAP Adjusted EBITDA definition to exclude non-cash compensation expense. Prior period results will be adjusted to the new definition.
The revision is intended to make IDT’s measure of Adjusted EBITDA more directly comparable to those reported by IDT’s peers while more closely reflecting consolidated and segment level cash flows.
IDT expects to generate a range of $141-$145 million of Adjusted EBITDA in FY 2026 under this revised measure of non-GAAP Adjusted EBITDA.
IDT’s consolidated non-cash compensation expense was $3.1 million and $7.4 million in FY 2025 and FY 2024, respectively. Utilizing this revised measure of Adjusted EBITDA, IDT generated $131.7 million and $97.1 million in Adjusted EBITDA during FY 2025 and FY 2024, respectively.
(Reconciliations of this revised measure of Adjusted EBITDA to net income and income from operations for FY 2025 and FY 2024 are included in the Non-GAAP reconciliations provided at the end of this release.)
DIVIDEND
On September 22, 2025, IDT’s Board of Directors declared a quarterly cash dividend of $0.06 per share. The dividend is payable on October 10, 2025 to stockholders of record as of September 30, 2025.
IDT EARNINGS ANNOUNCEMENT INFORMATION
This release is available for download in the “Investors & Media” section of the IDT Corporation website (https://www.idt.net/investors-and-media) and has been filed on a current report (Form 8-K) with the SEC.
IDT will host an earnings conference call beginning at 5:30 PM Eastern today with management’s discussion of results followed by Q&A with investors. To listen to the call and participate in the Q&A, dial 1-888-506-0062 (toll-free from the U.S.) or 1-973-528-0011 (international) and provide the following access code: 849358.
A replay of the conference call will be available approximately three hours after the call concludes through October 13, 2025. To access the call replay, dial 1-877-481-4010 (toll-free from the U.S.) or 1-919-882-2331 (international) and provide this replay passcode: 52805. The replay will also be accessible via streaming audio at the IDT investor relations website.
ABOUT IDT CORPORATION
IDT Corporation (NYSE: IDT) is a global provider of fintech and communications solutions through a portfolio of synergistic businesses: National Retail Solutions (NRS), through its point-of-sale (POS) platform, enables independent retailers to operate more effectively while providing advertisers and marketers with unprecedented reach into underserved consumer markets; BOSS Money facilitates innovative international remittances and fintech payments solutions; net2phone provides enterprises and organizations with intelligently integrated cloud communications and contact center services across channels and devices; IDT Digital Payments and the BOSS Revolution calling service make sharing prepaid products and services and speaking with friends and family around the world convenient and reliable; and, IDT Global and IDT Express enable communications services to provision and manage international voice and SMS messaging.
All statements above that are not purely about historical facts, including, but not limited to, those in which we use the words “believe,” “anticipate,” “expect,” “plan,” “intend,” “estimate,” “target” and similar expressions, are forward-looking statements within the meaning of the Private Securities Litigation Reform Act of 1995. While these forward-looking statements represent our current judgment of what may happen in the future, actual results may differ materially from the results expressed or implied by these statements due to numerous important factors. Our filings with the SEC provide detailed information on such statements and risks and should be consulted along with this release. To the extent permitted under applicable law, IDT assumes no obligation to update any forward-looking statements.
Trade accounts receivable, net of allowance for credit losses of $9,097 and $6,352 at July 31, 2025 and 2024, respectively
42,867
42,215
Settlement assets, net of reserve of $1,367 and $1,866 at July 31, 2025 and 2024, respectively
28,014
22,186
Disbursement prefunding
37,097
30,736
Prepaid expenses
14,505
17,558
Other current assets
28,702
25,927
TOTAL CURRENT ASSETS
520,303
422,525
Property, plant, and equipment, net
38,869
38,652
Goodwill
26,488
26,288
Other intangibles, net
5,056
6,285
Equity investments
6,658
6,518
Operating lease right-of-use assets
1,878
3,273
Deferred income tax assets, net
18,790
35,008
Other assets
8,161
11,546
TOTAL ASSETS
$
626,203
$
550,095
LIABILITIES, REDEEMABLE NONCONTROLLING INTEREST, AND EQUITY
CURRENT LIABILITIES:
Trade accounts payable
$
19,435
$
24,773
Accrued expenses
97,295
103,176
Deferred revenue
27,726
30,364
Customer funds deposits
114,708
91,893
Settlement liabilities
13,922
12,764
Other current liabilities
19,910
16,374
TOTAL CURRENT LIABILITIES
292,996
279,344
Operating lease liabilities
1,103
1,533
Other liabilities
1,688
2,662
TOTAL LIABILITIES
295,787
283,539
Commitments and contingencies
Redeemable noncontrolling interest
11,459
10,901
EQUITY:
IDT Corporation stockholders’ equity:
Preferred stock, $.01 par value; authorized shares-10,000; no shares issued
–
–
Class A common stock, $.01 par value; authorized shares-35,000; 3,272 shares issued and 1,574 shares outstanding at July 31, 2025 and 2024
33
33
Class B common stock, $.01 par value; authorized shares-200,000; 28,528 and 28,177 shares issued and 23,656 and 23,684 shares outstanding at July 31, 2025 and 2024, respectively
285
282
Additional paid-in capital
308,111
303,510
Treasury stock, at cost, consisting of 1,698 and 1,698 shares of Class A common stock and 4,872 and 4,493 shares of Class B common stock at July 31, 2025 and 2024, respectively
(143,853
)
(126,080
)
Accumulated other comprehensive loss
(16,569
)
(18,142
)
Retained earnings
157,124
86,580
Total IDT Corporation stockholders’ equity
305,131
246,183
Noncontrolling interests
13,826
9,472
TOTAL EQUITY
318,957
255,655
TOTAL LIABILITIES, REDEEMABLE NONCONTROLLING INTEREST, AND EQUITY
$
626,203
$
550,095
IDT CORPORATION
CONSOLIDATED STATEMENTS OF INCOME
Year ended July 31 (in thousands, except per share data)
2025
2024
2023
REVENUES
$
1,231,495
$
1,205,778
$
1,238,854
DIRECT COST OF REVENUES
785,300
815,621
881,614
GROSS PROFIT
446,195
390,157
357,240
OPERATING EXPENSES:
Selling, general and administrative (i)
287,567
270,207
243,159
Technology and development (i)
50,964
50,554
47,988
Severance
898
1,698
935
Other operating expense, net
6,342
2,945
4,415
TOTAL OPERATING EXPENSES
345,771
325,404
296,497
Income from operations
100,424
64,753
60,743
Interest income, net
6,127
4,769
3,147
Other expense, net
(713
)
(7,612
)
(3,083
)
Income before income taxes
105,838
61,910
60,807
(Provision for) benefit from income taxes
(24,699
)
6,354
(16,441
)
NET INCOME
81,139
68,264
44,366
Net income attributable to noncontrolling interests
(5,045
)
(3,810
)
(3,874
)
NET INCOME ATTRIBUTABLE TO IDT CORPORATION
$
76,094
$
64,454
$
40,492
Earnings per share attributable to IDT Corporation common stockholders:
Basic
$
3.02
$
2.55
$
1.59
Diluted
$
3.01
$
2.54
$
1.58
Weighted-average number of shares used in calculation of earnings per share:
Basic
25,188
25,241
25,517
Diluted
25,295
25,398
25,577
(i) Stock-based compensation included in total operating expenses
$
3,074
$
7,397
$
4,518
IDT CORPORATION
CONSOLIDATED STATEMENTS OF CASH FLOWS
Year ended July 31 (in thousands)
2025
2024
2023
OPERATING ACTIVITIES
Net income
$
81,139
$
68,264
$
44,366
Adjustments to reconcile net income to net cash provided by operating activities:
Depreciation and amortization
21,008
20,351
20,136
Deferred income taxes
16,217
(10,907
)
12,601
Provision for credit losses, doubtful accounts receivable, and reserve for settlement assets
7,090
4,390
2,198
Stock-based compensation
3,074
7,397
4,518
Other
2,199
4,579
6,543
Changes in assets and liabilities:
Trade accounts receivable
(6,459
)
(12,701
)
4,726
Settlement assets, disbursement prefunding, prepaid expenses, other current assets, and other assets
(8,556
)
12,735
(17,503
)
Trade accounts payable, accrued expenses, settlement liabilities, other current liabilities, and other liabilities
(4,814
)
(9,081
)
(21,001
)
Customer funds deposits
19,235
(1,820
)
(2,152
)
Deferred revenue
(3,072
)
(5,016
)
(2,029
)
Net cash provided by operating activities
127,061
78,191
52,403
INVESTING ACTIVITIES
Capital expenditures
(20,770
)
(18,922
)
(21,958
)
Notes receivable from equity method investment
(1,900
)
–
–
Purchase of convertible preferred stock in equity method investment
(926
)
(2,017
)
(840
)
Purchases of debt securities and equity investments
(33,453
)
(29,921
)
(59,872
)
Proceeds from maturities and sales of debt securities and redemption of equity investments
36,310
50,112
49,211
Net cash used in investing activities
(20,739
)
(748
)
(33,459
)
FINANCING ACTIVITIES
Dividends paid
(5,550
)
(2,536
)
–
Distributions to noncontrolling interests
(100
)
(112
)
(348
)
Proceeds from borrowings under revolving credit facility
24,551
32,864
27,383
Repayments of borrowings under revolving credit facility
(24,551
)
(32,864
)
(27,383
)
Purchase of restricted shares of net2phone and National Retail Solutions common stock
–
(4,131
)
–
Proceeds from exercise of stock options
–
172
172
Repurchases of Class B common stock
(17,773
)
(10,619
)
(13,896
)
Net cash used in financing activities
(23,423
)
(17,226
)
(14,072
)
Effect of exchange rate changes on cash, cash equivalents, and restricted cash and cash equivalents
3,477
(3,584
)
4,389
Net increase in cash, cash equivalents, and restricted cash and cash equivalents
86,376
56,633
9,261
Cash, cash equivalents, and restricted cash and cash equivalents at beginning of year
255,456
198,823
189,562
Cash, cash equivalents, and restricted cash and cash equivalents at end of year
$
341,832
$
255,456
$
198,823
SUPPLEMENTAL DISCLOSURE OF CASH FLOW INFORMATION
Cash payments made for interest
$
110
$
429
$
536
Cash payments made for income taxes
$
279
$
527
$
777
SUPPLEMENTAL SCHEDULE OF NON-CASH INVESTING AND FINANCING ACTIVITIES
Value of the Company’s Class B common stock exchanged for National Retail Solutions shares
$
442
$
6,696
$
–
Conversion of equity method investment’s secured promissory notes into convertible preferred stock
$
–
$
–
$
4,038
Shares of the Company’s Class B common stock issued to certain executive officers for bonus payments
$
1,824
$
1,494
$
615
Shares of the Company’s Class B common stock issued for business acquisitions
$
100
$
100
Reconciliation of Non-GAAP Financial Measures for the Fourth Quarter and Full Fiscal Years 2025 and 2024
In addition to disclosing financial results that are determined in accordance with generally accepted accounting principles in the United States of America (GAAP), IDT also disclosed (a) Adjusted EBITDA for 4Q25, 3Q25, 4Q24, and the full fiscal years 2025 and 2024, (b) non-GAAP earnings per diluted share (Non-GAAP EPS) for 4Q25, 4Q24, and the full fiscal years 2025 and 2024, (c) NRS’ ‘Rule of 40’ score for 4Q25, and (d) non-GAAP adjusted net cash provided by operating activities for 4Q25, 4Q24 and the full fiscal years 2025 and 2024. These are non-GAAP financial measures intended to provide useful information that supplements IDT’s or the relevant segment’s results in accordance with GAAP. The following explains these terms and their respective reconciliations to the most directly comparable GAAP measures.
Generally, a non-GAAP measure is a numerical measure of a company’s performance, financial position, or cash flows that either excludes or includes amounts that are not normally excluded or included in the most directly comparable measure calculated and presented in accordance with GAAP.
IDT’s measure of Non-GAAP EPS is calculated by dividing non-GAAP net income by the diluted weighted-average shares. IDT’s measure of non-GAAP net income starts with net income attributable to IDT in accordance with GAAP and adds severance expense, stock-based compensation, and other operating expenses, and deducts other operating gains. These additions and subtractions are non-cash and/or non-routine items in the relevant fiscal 2025 and fiscal 2024 periods.
Management believes that IDT’s Adjusted EBITDA and Non-GAAP EPS are measures which provide useful information to both management and investors by excluding certain expenses and non-routine gains and losses that may not be indicative of IDT’s or the relevant segment’s core operating results. Management uses Adjusted EBITDA, among other measures, as a relevant indicator of core operational strengths in its financial and operational decision making. In addition, management uses Adjusted EBITDA and Non-GAAP EPS to evaluate operating performance in relation to IDT’s competitors. Disclosure of these financial measures may be useful to investors in evaluating performance and allow for greater transparency of the underlying supplemental information used by management in its financial and operational decision-making. In addition, IDT has historically reported similar financial measures and believes such measures are commonly used by readers of financial information in assessing performance, therefore the inclusion of comparative numbers provides consistency in financial reporting.
Management refers to Adjusted EBITDA, as well as the GAAP measures income (loss) from operations and net income, on a segment and/or consolidated level to facilitate internal and external comparisons to the segments’ and IDT’s historical operating results, in making operating decisions, for budget and planning purposes, and to form the basis upon which management is compensated.
While depreciation and amortization are considered operating costs under GAAP, these expenses primarily represent the non-cash current period allocation of costs associated with long-lived assets acquired or capitalized in prior periods. IDT’s Adjusted EBITDA, which is exclusive of depreciation and amortization, is a useful indicator of its current performance.
Severance expense is excluded from the calculation of Adjusted EBITDA and Non-GAAP EPS. Severance expense is reflective of decisions made by management in each period regarding the aspects of IDT’s and its segments’ businesses to be focused on in light of changing market realities and other factors. While there may be similar charges in other periods, the nature and magnitude of these charges can fluctuate markedly and do not reflect the performance of IDT’s core and continuing operations.
Other operating expense, net, which is a component of income (loss) from operations, is excluded from the calculation of Adjusted EBITDA and Non-GAAP EPS. Other operating expense, net primarily includes legal fees net of insurance claims related to Straight Path Communications Inc.’s stockholders’ class action and gains from the write-off of contingent consideration liabilities. From time-to-time, IDT may have gains or incur costs related to non-routine legal, tax, and other matters, however, these various items generally do not occur each quarter. IDT believes the gain and losses from these non-routine matters are not components of IDT’s or the relevant segment’s core operating results.
Stock-based compensation recognized by IDT and other companies may not be comparable because of the variety of types of awards as well as the various valuation methodologies and subjective assumptions that are permitted under GAAP. Stock-based compensation is excluded from IDT’s calculation of Non-GAAP EPS because management believes this allows investors to make more meaningful comparisons of the operating results per share of IDT’s core business with the results of other companies. However, stock-based compensation will continue to be a significant expense for IDT for the foreseeable future and an important part of employees’ compensation that impacts their performance.
In 4Q25, IDT decreased its deferred income tax valuation allowance due to profitability in the United Kingdom and recorded an income tax benefit of $3.3 million. In 4Q24, because of the completion of an Internal Revenue Code Section 382 study related to net2phone, IDT recorded an income tax benefit of $23.6 million. These income tax benefits were excluded from IDT’s non-GAAP EPS because they were not related to the results of IDT’s core operations.
Adjusted EBITDA and Non-GAAP EPS should be considered in addition to, not as a substitute for, or superior to, income (loss) from operations, cash flow from operating activities, net income, basic and diluted earnings per share or other measures of liquidity and financial performance prepared in accordance with GAAP. In addition, IDT’s measurements of Adjusted EBITDA and Non-GAAP EPS may not be comparable to similarly titled measures reported by other companies.
The ‘Rule of 40’ score is a metric used to evaluate the performance of SaaS providers. It postulates that a SaaS provider’s revenue growth rate plus its EBITDA margin should equal or exceed 40 percent. The ‘Rule of 40’ is typically used to assess a company’s balance between growth and profitability. A total of over 40 is thought to indicate a healthy combination of expansion and financial stability, making it a useful tool for management and investors to gauge the potential for long-term success and make informed decisions about resource allocation and business strategy.
NRS’ ‘Rule of 40′ score is computed by adding (a) the growth rate of NRS’ recurring revenue for the relevant period compared to the corresponding year ago period to (b) NRS’ Adjusted EBITDA margin for the twelve-month period through the end of the current period. NRS’ recurring revenue is calculated by subtracting NRS’ revenue from POS terminal sales from its total GAAP revenue. Adjusted EBITDA is a non-GAAP measure as discussed above. Adjusted EBITDA margin is calculated by dividing Adjusted EBITDA by GAAP revenue for the relevant period.
IDT’s Non-GAAP adjusted measure of net cash provided by operating activities is calculated by excluding the impact of changes in customer deposits from net cash provided by operating activities. This measure provides a more meaningful measure of the cash generated by our core business operations, making it a more useful tool for management and investors to evaluate the cash generation of our business operations, and to compare IDT’s cash generation with companies that do not have, or have different levels of, customer deposits. Customer deposits are, by regulation, not available to fund IDT’s operating activities.
Following are reconciliations of Adjusted EBITDA and Non-GAAP EPS to the most directly comparable GAAP measure, which are, (a) for Adjusted EBITDA, (i) income (loss) from operations for IDT’s reportable segments and (ii) net income for IDT on a consolidated basis, and (b) for Non-GAAP EPS, diluted earnings per share. Also following is NRS’ ‘Rule of 40′ score computation including the reconciliation of NRS’ Adjusted EBITDA to the most directly comparable GAAP measure, NRS’ income from operations, and IDT’s Non-GAAP adjusted measure of net cash provided by operating activities reconciled to GAAP net cash provided by operating activities.
IDT Corporation Reconciliation of Net Income to Adjusted EBITDA for 4Q25, 3Q25, and 4Q24 (unaudited) in millions. Figures may not foot or cross-foot due to rounding
Total IDT Corporation
Traditional Comm.
net2phone
NRS
Fintech
Corporate
Three Months Ended July 31, 2025 (4Q25)
Net income attributable to IDT Corporation
$
16.9
Adjustments:
Net income attributable to noncontrolling interests
0.6
Net income
17.5
Provision for income taxes
2.9
Income before income taxes
20.4
Interest income, net
(1.8
)
Other expense, net
3.2
Income (loss) from operations
21.9
$
15.4
$
1.5
$
5.8
$
4.8
$
(5.7
)
Depreciation and amortization
5.3
1.8
1.6
1.1
0.7
–
Other operating expense, net
5.9
0.2
0.2
2.4
–
3.1
Severance expense
0.3
0.1
0.1
–
–
–
Adjusted EBITDA
$
33.4
$
17.6
$
3.5
$
9.3
$
5.5
$
(2.5
)
Total IDT Corporation
Traditional Comm.
net2phone
NRS
Fintech
Corporate
Three Months Ended April 30, 2025 (3Q25)
Net income attributable to IDT Corporation
$
21.7
Adjustments:
Net income attributable to noncontrolling interests
1.3
Net income
23.0
Provision for income taxes
7.8
Income before income taxes
30.8
Interest income, net
(1.6
)
Other income, net
(2.6
)
Income (loss) from operations
26.6
$
17.3
$
1.4
$
6.2
$
4.3
$
(2.6
)
Depreciation and amortization
5.2
1.9
1.6
1.0
0.7
–
Other operating expense, net
0.2
–
0.2
–
–
–
Severance expense
0.2
0.2
–
–
–
–
Adjusted EBITDA
$
32.2
$
19.3
$
3.2
$
7.2
$
5.0
$
(2.6
)
Total IDT Corporation
Traditional Comm.
net2phone
NRS
Fintech
Corporate
Three Months Ended July 31, 2024 (4Q24)
Net income attributable to IDT Corporation
$
36.8
Adjustments:
Net income attributable to noncontrolling interests
0.9
Net income
37.7
Benefit from income taxes
(17.3
)
Income before income taxes
20.4
Interest income, net
(1.6
)
Other expense, net
1.3
Income (loss) from operations
20.1
$
13.9
$
0.8
$
6.0
$
2.5
$
(3.2
)
Depreciation and amortization
5.1
1.9
1.6
0.9
0.7
–
Severance expense
–
0.3
–
–
–
(0.3
)
Other operating (gains) expense, net
(0.1
)
0.2
–
0.2
(1.8
)
1.3
Adjusted EBITDA
$
25.2
$
16.3
$
2.5
$
7.1
$
1.5
$
(2.2
)
IDT Corporation Reconciliation of Net Income to Adjusted EBITDA for FY 2025 and FY 2024 (unaudited) in millions. Figures may not foot or cross-foot due to rounding
Total IDT Corporation
Traditional Communica-tions
net2phone
NRS
Fintech
Corporate
Year Ended July 31, 2025 (FY 2025)
Net income attributable to IDT Corporation
$
76.1
Adjustments:
Net income attributable to noncontrolling interests
5.0
Net income
81.1
Provision for income taxes
24.7
Income before income taxes
105.8
Interest income, net
(6.1
)
Other expense, net
0.7
Income (loss) from operations
100.4
$
66.5
$
4.9
$
27.8
$
15.4
$
(14.2
)
Depreciation and amortization
21.0
7.6
6.4
4.1
2.9
0.1
Severance
0.9
0.7
0.1
–
–
–
Other operating expense, net
6.3
0.2
0.6
2.4
–
3.1
Adjusted EBITDA
$
128.7
$
75.0
$
12.1
$
34.2
$
18.4
$
(11.1
)
Total IDT Corporation
Traditional Communica-tions
net2phone
NRS
Fintech
Corporate
Year Ended July 31, 2024 (FY 2024)
Net income attributable to IDT Corporation
$
64.5
Adjustments:
Net income attributable to noncontrolling interests
3.8
Net income
68.3
Benefit from income taxes
(6.4
)
Income before income taxes
61.9
Interest income, net
(4.8
)
Other expense, net
7.6
Income (loss) from operations
64.8
$
56.4
$
1.7
$
21.6
$
(0.1
)
$
(14.9
)
Depreciation and amortization
20.4
8.1
6.1
3.2
2.9
0.1
Severance
1.7
1.6
0.1
–
–
–
Other operating expense (gains), net
2.9
0.2
(0.1
)
0.2
(1.8
)
4.4
Adjusted EBITDA
$
89.7
$
66.3
$
7.9
$
25.0
$
1.1
$
(10.4
)
IDT Corporation
Reconciliation of Net Income to Revised Adjusted EBITDA for FY 2025 and FY 2024 (unaudited) in millions. Figures may not foot or cross-foot due to rounding
Beginning in fiscal 2026, IDT will include stock-based compensation expense in its calculation of Adjusted EBITDA. Accordingly, the Adjusted EBITDA presented below reflects this revised measure.
Total IDT Corporation
Traditional Communica-tions
net2phone
NRS
Fintech
Corporate
Year Ended July 31, 2025 (FY 2025)
Net income attributable to IDT Corporation
$
76.1
Adjustments:
Net income attributable to noncontrolling interests
5.0
Net income
81.1
Provision for income taxes
24.7
Income before income taxes
105.8
Interest income, net
(6.1
)
Other expense, net
0.7
Income (loss) from operations
100.4
$
66.5
$
4.9
$
27.8
$
15.4
$
(14.2
)
Depreciation and amortization
21.0
7.6
6.4
4.1
2.9
0.1
Stock-based compensation
3.1
1.4
–
1.1
0.2
0.4
Severance
0.9
0.7
0.1
–
–
–
Other operating expense, net
6.3
0.2
0.6
2.4
–
3.1
Adjusted EBITDA
$
131.7
$
76.4
$
12.1
$
35.7
$
18.5
$
(10.6
)
Total IDT Corporation
Traditional Communica-tions
net2phone
NRS
Fintech
Corporate
Year Ended July 31, 2024 (FY 2024)
Net income attributable to IDT Corporation
$
64.5
Adjustments:
Net income attributable to noncontrolling interests
3.8
Net income
68.3
Provision for income taxes
(6.4
)
Income before income taxes
61.9
Interest income, net
(4.8
)
Other expense, net
7.6
Income (loss) from operations
64.8
$
56.4
$
1.7
$
21.6
$
(0.1
)
$
(14.9
)
Depreciation and amortization
21.4
8.1
6.1
3.2
2.9
0.1
Stock-based compensation
7.4
5.4
–
1.2
0.3
0.5
Severance
1.7
1.6
0.1
–
–
–
Other operating expense (gains), net
2.9
0.2
(0.1
)
0.2
(1.8
)
4.4
Adjusted EBITDA
$
97.1
$
7 1.7
$
7.9
$
26.2
$
1.3
$
(9.9
)
IDT Corporation Reconciliation of Earnings Per Share (EPS) to Non-GAAP EPS for 4Q25, 4Q24, FY 2025 and FY 2024 (unaudited) in millions, except per share data. Figures may not foot due to rounding
4Q25
4Q24
FY 2025
FY 2024
Net income attributable to IDT Corporation
$
16.9
$
36.8
$
76.1
$
64.5
Adjustments (add) subtract:
Income tax benefit
3.3
23.6
3.3
23.6
Stock-based compensation
(0.4
)
(2.0
)
(3.1
)
(7.4
)
Severance expense
(0.3
)
(0.1
)
(0.9
)
(1.7
)
Other operating (expense) gain, net
(5.9
)
0.1
(6.3
)
(2.9
)
Total adjustments
(3.3
)
21.6
(7.0
)
11.6
Income tax effect of total adjustments
(0.9
)
(0.6
)
(2.3
)
(3.4
)
2.4
(22.2
)
4.7
(15.0
)
Non-GAAP net income
$
19.3
$
14.6
$
80.8
$
49.5
Earnings per share:
Basic
$
0.67
$
1.46
$
3.02
$
2.55
Total adjustments
0.09
(0.88
)
0.18
(0.59
)
Non-GAAP – basic
$
0.76
$
0.58
$
3.20
$
1.96
Weighted-average number of shares used in calculation of basic earnings per share
25.2
25.3
25.2
25.2
Diluted
$
0.67
$
1.45
$
3.01
$
2.54
Total adjustments
0.09
(0.88
)
0.18
(0.59
)
Non-GAAP – diluted
$
0.76
$
0.57
$
3.19
$
1.95
Weighted-average number of shares used in calculation of diluted earnings per share
25.2
25.4
25.3
25.4
IDT Corporation NRS’ ‘Rule of 40’ Score For 4Q25 (unaudited) in millions. Figures may not foot due to rounding to millions
1Q25
2Q25
3Q25
4Q25
Trailing Twelve Months (TTM) 4Q25
Reconciliation of NRS’ Income from Operations to Adjusted EBITDA
Income from operations
$
6.6
$
9.1
$
6.2
$
5.8
$
27.8
Depreciation and amortization
1.0
1.0
1.0
1.1
4.1
Other operating expense, net
–
–
–
2.4
2.4
Adjusted EBITDA
$
7.6
$
10.1
$
7.2
$
9.3
$
34.2
4Q25
4Q24
NRS’ ‘Rule of 40’ Score
NRS recurring revenue
$
32.6
$
26.7
NRS other revenue
1.7
1.6
NRS total revenue
$
34.3
$
28.2
NRS recurring revenue growth rate
22
%
NRS TTM Adjusted EBITDA from above
$
34.2
NRS TTM total revenue
128.8
NRS TTM Adjusted EBITDA margin
27
%
Rule of 40
49
%
IDT Corporation
Adjusted net cash provided by operating activities for 4Q25, 4Q24, FY 2025 and FY 2024 (unaudited) in millions. Figures may not foot due to rounding to millions
(in millions) Three months ended July 31
2025
2024
Net cash provided by operating activities (GAAP)
$
31.0
$
25.4
Changes in customer deposits
6.1
3.1
Adjusted net cash provided by operating activities (non-GAAP)
$
37.1
$
28.5
(in millions) Full year ended July 31
2025
2024
Net cash provided by operating activities (GAAP)
$
127.1
$
78.2
Changes in customer deposits
(19.2
)
3.4
Adjusted net cash provided by operating activities (non-GAAP)
$
107.8
$
81.6
Explanation of Key Performance Metrics
net2phone’s subscription revenue is calculated by subtracting net2phone’s equipment revenue and revenue generated by a legacy SIP trunking offering in Brazil from its revenue in accordance with GAAP. net2phone’s cloud communications and contact center offerings are priced on a per-seat basis, with customers paying based on the number of users in their organization. The number of seats served and subscription revenue trends and comparisons between periods are used in the analysis of net2phone’s revenues and direct cost of revenues and are strong indications of the top-line growth and performance of the business.
Constant currency as it relates to revenue provides a framework for assessing net2phone’s performance that excludes the effect of foreign currency rate fluctuations. To determine net2phone’s subscription revenue growth on a constant currency basis, current period revenues from entities reporting in currencies other than U.S. Dollars (USD) were converted to USD at the average monthly exchange rates in effect during the prior fiscal year’s comparative period instead of the average monthly exchange rates in effect during the current period.
NRS’ Monthly Average Recurring Revenue per Terminal is calculated by dividing NRS’ recurring revenue as defined in the Reconciliation of Non-GAAP Financial Measures by the average number of active POS terminals during the period. The average number of active POS terminals is calculated by adding the beginning and ending number of active POS terminals during the period and dividing by two. NRS’ recurring revenue divided by the average number of active POS terminals is divided by three when the period is a fiscal quarter. Recurring revenue and Monthly Average Recurring Revenue per Terminal are useful for comparisons of NRS’ revenue and revenue per customer to prior periods and to competitors and others in the market, as well as for forecasting future revenue from the customer base.
BOSS Money transactions are a nonfinancial metric that measures customer usage during a reporting period. BOSS Money’s digital send volume is the aggregate amount of principal remitted by BOSS Money’s digital customers – those using the BOSS Money and BOSS Revolutions apps to originate remittances. Digital send volume is a key metric for evaluating the operational performance of the digital channel of the remittance business, and for comparing the performance of BOSS Money’s digital channel to competitors in the remittance business as well as to performance to other temporal periods.
# # #
IDT Corporation to Present at Sidoti September Investor Conference
NEWARK, NJ, Sept. 16, 2025 (GLOBE NEWSWIRE) — IDT Corporation (NYSE: IDT), a provider of fintech and communications solutions, will participate in the Sidoti September Virtual Investor Conference on September 17th and 18th, 2025.
Marcelo Fischer, IDT’s Chief Financial Officer, and Bill Ulrey, VP Investor Relations, will provide an overview of the company’s operations, strategy, and financial results (through the third quarter of IDT’s fiscal year 2025) from 10:45 until 11:15 AM Eastern Time on Wednesday, September 17th. Mr. Fischer will also host one-on-one investor meetings during the conference.
To register for the presentation or to request one-on-ones, visit www.sidoti.com/events. Registration is free of charge and open to the public.
All statements above that are not purely about historical facts, including, but not limited to, those in which we use the words “believe,” “anticipate,” “expect,” “plan,” “intend,” “estimate,” “target” and similar expressions, are forward-looking statements within the meaning of the Private Securities Litigation Reform Act of 1995. While these forward-looking statements represent our current judgment of what may happen in the future, actual results may differ materially from the results expressed or implied by these statements due to numerous important factors. Our filings with the SEC provide detailed information on such statements and risks, and should be consulted along with this release. To the extent permitted under applicable law, IDT assumes no obligation to update any forward-looking statements.
ABOUT IDT CORPORATION IDT Corporation (NYSE: IDT) is a global provider of fintech and communications solutions through a portfolio of synergistic businesses: National Retail Solutions (NRS), through its point-of-sale (POS) platform, enables independent retailers to operate more effectively while providing advertisers and marketers with unprecedented reach into underserved consumer markets; BOSS Money facilitates innovative international remittances and fintech payments solutions; net2phone provides enterprises and organizations with intelligently integrated cloud communications and contact center services across channels and devices; IDT Digital Payments and the BOSS Revolution calling service make sharing prepaid products and services and speaking with friends and family around the world convenient and reliable; and, IDT Global and IDT Express enable communications services to provision and manage international voice and SMS messaging.