IDT Corporation to Report Fourth Quarter and Fiscal Year 2025 Results
NEWARK, NJ, Sept. 15, 2025 (GLOBE NEWSWIRE) — IDT Corporation (NYSE: IDT), a global provider of fintech and communications solutions, has scheduled its report of financial and operational results for the fourth quarter and full fiscal year 2025 (the three and twelve months ended July 31, 2025) on Monday, September 29, 2025.
IDT’s earnings release will be issued and posted on the IDT investor relations website (https://www.idt.net/investors-and–media) at approximately 4:30 PM Eastern.
IDT will host an earnings conference call beginning at 5:30 PM Eastern with management’s discussion of results followed by Q&A with investors. To listen to the call and participate in the Q&A, dial 1-888-506-0062 (toll-free from the US) or 1-973-528-0011 (international) and provide the following access code: 849358.
A replay of the conference call will be available approximately three hours after the call concludes through October 13, 2025. To access the call replay, dial 1-877-481-4010 (toll-free from the US) or 1-919-882-2331 (international) and provide this replay passcode: 52805. The replay will also be accessible via streaming audio at the IDT investor relations website.
ABOUT IDT CORPORATION IDT Corporation (NYSE: IDT) is a global provider of fintech and communications solutions through a portfolio of synergistic businesses: National Retail Solutions (NRS), through its point-of-sale (POS) platform, enables independent retailers to operate more effectively while providing advertisers and marketers with unprecedented reach into underserved consumer markets; BOSS Money facilitates innovative international remittances and fintech payments solutions; net2phone provides enterprises and organizations with intelligently integrated cloud communications and contact center services across channels and devices; IDT Digital Payments and the BOSS Revolution calling service make sharing prepaid products and services and speaking with friends and family around the world convenient and reliable; and, IDT Global and IDT Express enable communications services to provision and manage international voice and SMS messaging.
NRSInsights’ August 2025 Retail Same-Store Sales Report
August same-store sales jumped 8.3% year-over-year – the largest increase in over two years
The average price paid for the top 500 items in August increased 3.0% year-over-year
NEWARK, N.J., Sept. 09, 2025 (GLOBE NEWSWIRE) — NRSInsights, a provider of sales data and analytics drawn from retail transactions processed through the National Retail Solutions (NRS) point-of-sale (POS) platform, today announced comparative retail same-store sales results for August 2025.
As of August 31, 2025, the NRS retail network comprised approximately 37,100 active terminals nationwide, scanning purchases at approximately 32,200 independent retailers including convenience stores, bodegas, liquor stores, grocers, and tobacco and sundries sellers, predominantly serving urban consumers.
August Highlights*
(*Same-store sales, unit sales, transactions, and average price data refer to August 2025 and are compared to August 2024 unless otherwise noted. All comparisons are provided on a “per calendar day” basis to remove from consideration variability in the number of days per month or three-month period.)
SALES
Same-store sales increased 8.3% year-over-year. In the previous month (July 2025), same-store sales increased 5.8% year-over-year.
Same-store sales increased 3.4% compared to the previous month (July 2025). Same-store sales in July 2025 increased 0.3% compared to the previous month (June 2025).
For the three months ended August 31, 2025, same-store sales increased 5.6% compared to the corresponding three months a year ago.
UNITS SOLD
Units sold increased 4.3% year-over-year. In the previous month (July 2025), units sold increased 3.2% year-over-year.
Units sold increased 1.8% compared to the previous month (July 2025). Units sold in July 2025 decreased 1.5% compared to the previous month (June 2025).
BASKETS (TRANSACTIONS) PER STORE
Baskets increased 2.6% year-over-year. In the previous month (July 2025), baskets increased 1.5% year-over-year.
Baskets increased 2.2% compared to the previous month (July 2025). Baskets in July 2025 decreased 0.4% compared to the previous month (June 2025).
AVERAGE PRICES
A dollar-weighted average of prices for the top 500 items purchased increased 3.0% year-over-year, a higher rate of increase than the 2.9% year-over-year increase recorded in July 2025.
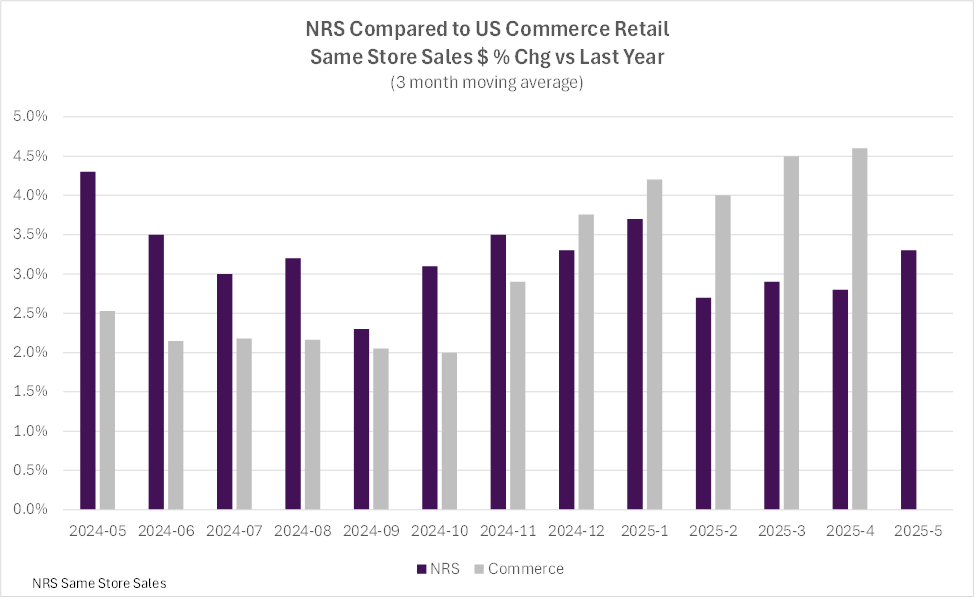
Retail Trade Comparative Data
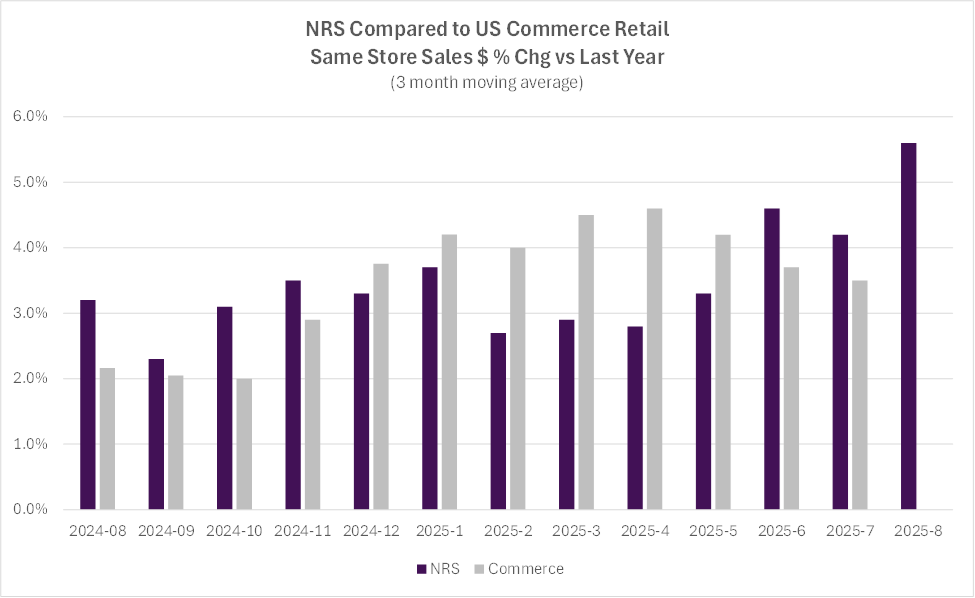
The table below provides historical comparative data with the U.S. Commerce Department’s Advance Monthly Retail Trade same-store sales data excluding food service:
Over the past twelve months through July 2025, the US Commerce Department’s Advance Monthly Retail Trade data, excluding food services, outpaced the NRS network’s three-month moving average same-store sales by 0.2% on average. In July, the NRS network’s three-month rolling average increase exceeded the US Commerce Department’s by 0.7%.
The NRSInsights data in the chart above have not been adjusted to reflect inflation, demographic distributions, seasonal buying patterns, item substitution, days per month, or other factors that may facilitate comparisons to other periods, to other same-store retail sales data, or to the U.S. Commerce Department’s retail data.
Commentary from Brandon Thurber (VP, Data Sales & Client Success at NRS)
“August was a good month for independent retailers, with very strong year over year and sequential increases in same store sales. Growth was fueled by more frequent shopping trips – transactions rose 2.6% – and larger baskets per trip – as unit sales climbed more rapidly at 4.3%.
“Average prices paid for the top 500 items sold across our network, which is our measure of inflation, increased 3% compared to August of last year, the highest rate of increase since last November.
“Consumers are turning to local independents not just for convenience but as a destination for key categories like Cigarettes, Prepared Cocktails, and Beer, the latter showing the strongest month-over-month momentum.”
NRSInsights Reports
The NRSInsights monthly Same-Store Retail Sales Reports are intended to provide timely topline data reflective of sales at NRS’ network of independent, predominantly urban, retail stores.
Same-store data comparisons of August 2025 with August 2024 are derived from approximately 232 million transactions processed through the approximately 23,200 stores on the NRS network that scanned transactions in both months. Same-store data comparisons of August 2025 with July 2025 are derived from approximately 286 million transactions processed through approximately 31,200 stores.
Same-store data comparisons for the three months ended August 31, 2025 with the year-ago three months are derived from approximately 657 million scanned transactions processed through those stores that scanned transactions in both three-month periods.
NRS POS Platform
The NRS platform predominantly serves small-format, independent, retail stores nationwide including convenience stores, bodegas, liquor stores, grocers, and tobacco and sundries sellers. These independent retailers operate in all 50 states and the District of Colombia, including 205 of the 210 designated market areas (DMAs) in the United States, and in Canada. During August 2025, NRS’ POS terminals processed $2.2 billion in sales (+18% year-over-year) across 148 million transactions.
About National Retail Solutions (NRS):
National Retail Solutions operates a leading point-of-sale (POS) terminal-based platform and digital payment processing service for independent retailers nationwide. Retailers utilize NRS offerings to process transactions and effectively manage their businesses. Consumer packaged goods (CPG) suppliers, brokers, analytics firms, and advertisers access the terminal’s digital display network to reach these retailers’ predominantly urban, multi-cultural shopper base, and to harness transaction data-based learnings to identify growth opportunities and measure execution and returns on marketing investment. NRS is a subsidiary of IDT Corporation (NYSE: IDT).
All statements above that are not purely about historical facts, including, but not limited to, those in which we use the words “believe,” “anticipate,” “expect,” “plan,” “intend,” “estimate,” “target” and similar expressions, are forward-looking statements within the meaning of the Private Securities Litigation Reform Act of 1995. While these forward-looking statements represent our current judgment of what may happen in the future, actual results may differ materially from the results expressed or implied by these statements due to numerous important factors. Our filings with the SEC provide detailed information on such statements and risks, and should be consulted along with this release. To the extent permitted under applicable law, IDT assumes no obligation to update any forward-looking statements.
NRSInsights Contact: Brandon Thurber VP, Data Sales & Client Success at NRS National Retail Solutions Brandon.Thurber@nrsplus.com
NRSInsights’ August 2025 Retail Same-Store Sales Report
August same-store sales jumped 8.3% year-over-year – the largest increase in over two years
The average price paid for the top 500 items in August increased 3.0% year-over-year
NEWARK, N.J., Sept. 09, 2025 (GLOBE NEWSWIRE) — NRSInsights, a provider of sales data and analytics drawn from retail transactions processed through the National Retail Solutions (NRS) point-of-sale (POS) platform, today announced comparative retail same-store sales results for August 2025.
As of August 31, 2025, the NRS retail network comprised approximately 37,100 active terminals nationwide, scanning purchases at approximately 32,200 independent retailers including convenience stores, bodegas, liquor stores, grocers, and tobacco and sundries sellers, predominantly serving urban consumers.
August Highlights*
(*Same-store sales, unit sales, transactions, and average price data refer to August 2025 and are compared to August 2024 unless otherwise noted. All comparisons are provided on a “per calendar day” basis to remove from consideration variability in the number of days per month or three-month period.)
SALES
Same-store sales increased 8.3% year-over-year. In the previous month (July 2025), same-store sales increased 5.8% year-over-year.
Same-store sales increased 3.4% compared to the previous month (July 2025). Same-store sales in July 2025 increased 0.3% compared to the previous month (June 2025).
For the three months ended August 31, 2025, same-store sales increased 5.6% compared to the corresponding three months a year ago.
UNITS SOLD
Units sold increased 4.3% year-over-year. In the previous month (July 2025), units sold increased 3.2% year-over-year.
Units sold increased 1.8% compared to the previous month (July 2025). Units sold in July 2025 decreased 1.5% compared to the previous month (June 2025).
BASKETS (TRANSACTIONS) PER STORE
Baskets increased 2.6% year-over-year. In the previous month (July 2025), baskets increased 1.5% year-over-year.
Baskets increased 2.2% compared to the previous month (July 2025). Baskets in July 2025 decreased 0.4% compared to the previous month (June 2025).
AVERAGE PRICES
A dollar-weighted average of prices for the top 500 items purchased increased 3.0% year-over-year, a higher rate of increase than the 2.9% year-over-year increase recorded in July 2025.
Retail Trade Comparative Data
The table below provides historical comparative data with the U.S. Commerce Department’s Advance Monthly Retail Trade same-store sales data excluding food service:
Over the past twelve months through July 2025, the US Commerce Department’s Advance Monthly Retail Trade data, excluding food services, outpaced the NRS network’s three-month moving average same-store sales by 0.2% on average. In July, the NRS network’s three-month rolling average increase exceeded the US Commerce Department’s by 0.7%.
The NRSInsights data in the chart above have not been adjusted to reflect inflation, demographic distributions, seasonal buying patterns, item substitution, days per month, or other factors that may facilitate comparisons to other periods, to other same-store retail sales data, or to the U.S. Commerce Department’s retail data.
Commentary from Brandon Thurber (VP, Data Sales & Client Success at NRS)
“August was a good month for independent retailers, with very strong year over year and sequential increases in same store sales. Growth was fueled by more frequent shopping trips – transactions rose 2.6% – and larger baskets per trip – as unit sales climbed more rapidly at 4.3%.
“Average prices paid for the top 500 items sold across our network, which is our measure of inflation, increased 3% compared to August of last year, the highest rate of increase since last November.
“Consumers are turning to local independents not just for convenience but as a destination for key categories like Cigarettes, Prepared Cocktails, and Beer, the latter showing the strongest month-over-month momentum.”
NRSInsights Reports
The NRSInsights monthly Same-Store Retail Sales Reports are intended to provide timely topline data reflective of sales at NRS’ network of independent, predominantly urban, retail stores.
Same-store data comparisons of August 2025 with August 2024 are derived from approximately 232 million transactions processed through the approximately 23,200 stores on the NRS network that scanned transactions in both months. Same-store data comparisons of August 2025 with July 2025 are derived from approximately 286 million transactions processed through approximately 31,200 stores.
Same-store data comparisons for the three months ended August 31, 2025 with the year-ago three months are derived from approximately 657 million scanned transactions processed through those stores that scanned transactions in both three-month periods.
NRS POS Platform
The NRS platform predominantly serves small-format, independent, retail stores nationwide including convenience stores, bodegas, liquor stores, grocers, and tobacco and sundries sellers. These independent retailers operate in all 50 states and the District of Colombia, including 205 of the 210 designated market areas (DMAs) in the United States, and in Canada. During August 2025, NRS’ POS terminals processed $2.2 billion in sales (+18% year-over-year) across 148 million transactions.
About National Retail Solutions (NRS):
National Retail Solutions operates a leading point-of-sale (POS) terminal-based platform and digital payment processing service for independent retailers nationwide. Retailers utilize NRS offerings to process transactions and effectively manage their businesses. Consumer packaged goods (CPG) suppliers, brokers, analytics firms, and advertisers access the terminal’s digital display network to reach these retailers’ predominantly urban, multi-cultural shopper base, and to harness transaction data-based learnings to identify growth opportunities and measure execution and returns on marketing investment. NRS is a subsidiary of IDT Corporation (NYSE: IDT).
All statements above that are not purely about historical facts, including, but not limited to, those in which we use the words “believe,” “anticipate,” “expect,” “plan,” “intend,” “estimate,” “target” and similar expressions, are forward-looking statements within the meaning of the Private Securities Litigation Reform Act of 1995. While these forward-looking statements represent our current judgment of what may happen in the future, actual results may differ materially from the results expressed or implied by these statements due to numerous important factors. Our filings with the SEC provide detailed information on such statements and risks, and should be consulted along with this release. To the extent permitted under applicable law, IDT assumes no obligation to update any forward-looking statements.
NRSInsights Contact: Brandon Thurber VP, Data Sales & Client Success at NRS National Retail Solutions Brandon.Thurber@nrsplus.com
NRSInsights’ July 2025 Retail Same-Store Sales Report
July same-store sales increased 5.8% year-over-year
NEWARK, N.J., Aug. 07, 2025 (GLOBE NEWSWIRE) — NRSInsights, a provider of sales data and analytics drawn from retail transactions processed through the National Retail Solutions (NRS) point-of-sale (POS) platform, today announced comparative retail same-store sales results for July 2025.
As of July 31, 2025, the NRS retail network comprised approximately 37,200 active terminals nationwide, scanning purchases at approximately 32,100 independent retailers including convenience stores, bodegas, liquor stores, grocers, and tobacco and sundries sellers, predominantly serving urban consumers.
July Highlights*
(*Same-store sales, unit sales, transactions, and average price data refer to July 2025 and are compared to July 2024 unless otherwise noted. All comparisons are provided on a “per calendar day” basis to remove from consideration variability in the number of days per month or three-month period.)
SALES
Same-store sales increased 5.8% year-over-year. In the previous month (June 2025), same-store sales increased 3.5% year-over-year.
Same-store sales increased 0.3% compared to the previous month (June 2025). Same-store sales in June 2025 were unchanged compared to the previous month (May 2025).
For the three months ended July 31, 2025, same-store sales increased 4.2% compared to the corresponding three months a year ago.
UNITS SOLD
Units sold increased 3.2% year-over-year. In the previous month (June 2025), units sold increased 3.0% year-over-year.
Units sold decreased 1.5% compared to the previous month (June 2025). Units sold in June 2025 increased 0.7% compared to the previous month (May 2025).
BASKETS (TRANSACTIONS) PER STORE
Baskets increased 1.5% year-over-year. In the previous month (June 2025), baskets were unchanged year-over-year.
Baskets decreased 0.4% compared to the previous month (June 2025). Baskets in June 2025 increased 0.6% compared to the previous month (May 2025).
AVERAGE PRICES
A dollar-weighted average of prices for the top 500 items purchased increased 2.9% year-over-year, a higher rate of increase than the 2.7% year-over-year increase recorded in June 2025.
Retail Trade Comparative Data
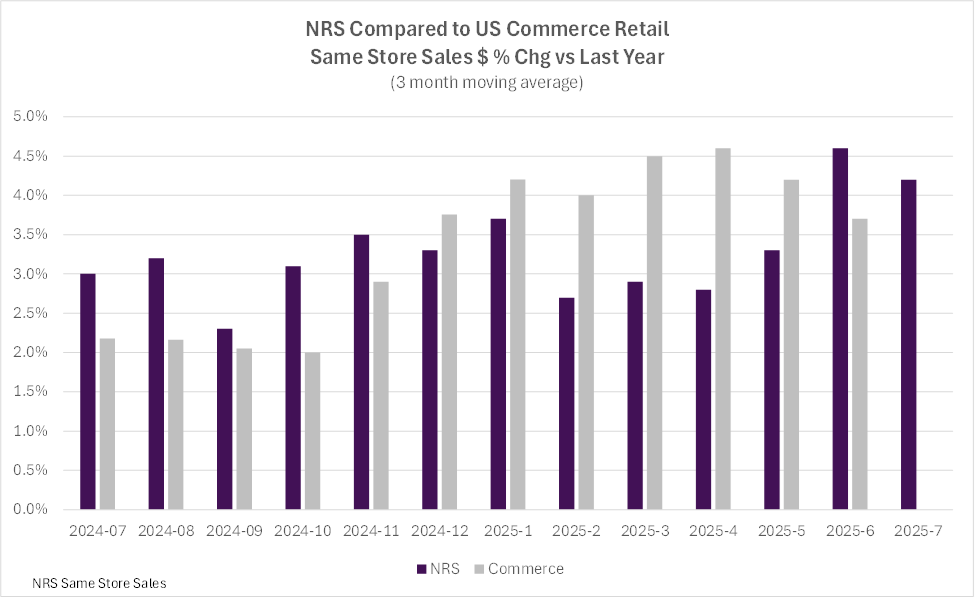
The table below provides historical comparative data with the U.S. Commerce Department’s Advance Monthly Retail Trade same-store sales data excluding food service:
Over the past twelve months, the US Commerce Department’s Advance Monthly Retail Trade data, excluding food services, outpaced the NRS network’s three-month moving average same-store sales by 0.2% on average. In June, the NRS network’s three-month rolling average increase exceeded the US Commerce Department’s by 0.9%.
The NRSInsights data in the chart above have not been adjusted to reflect inflation, demographic distributions, seasonal buying patterns, item substitution, days per month, or other factors that may facilitate comparisons to other periods, to other same-store retail sales data, or to the U.S. Commerce Department’s retail data.
Commentary from Brandon Thurber (VP, Data Sales & Client Success at NRS)
“Independent retailers performed extremely well in July. Sales increased by 5.8% versus last year – the highest rate of increase in over a year, and a robust increase even after taking into account the 2.9% year-over-year increase in the average price of top selling items.
“Beverage performance helped drive the expansion. Energy drinks, soft drinks, and both sparkling and seltzer waters all delivered solid gains. Sports drinks were stable year-over-year and up month-over-month.
“Shifts in consumer behavior spurred continued growth in prepared cocktails, modern oral nicotine, and performance and nutrition shakes, while certain snack categories remained under pressure.”
NRSInsights Reports
The NRSInsights monthly Same-Store Retail Sales Reports are intended to provide timely topline data reflective of sales at NRS’ network of independent, predominantly urban, retail stores.
Same-store data comparisons of July 2025 with July 2024 are derived from approximately 226 million transactions processed through the approximately 23,000 stores on the NRS network that scanned transactions in both months. Same-store data comparisons of July 2025 with June 2025 are derived from approximately 278 million transactions processed through approximately 31,000 stores.
Same-store data comparisons for the three months ended July 31, 2025 with the year-ago three months are derived from approximately 649 million scanned transactions processed through those stores that scanned transactions in both three-month periods.
NRS POS Platform
The NRS platform predominantly serves small-format, independent, retail stores nationwide including convenience stores, bodegas, liquor stores, grocers, and tobacco and sundries sellers. These independent retailers operate in all 50 states as well as the District of Columbia, and in 205 of the 210 designated market areas (DMAs) in the United States. During July 2025, NRS’ POS terminals processed $2.1 billion in sales (+18% year-over-year) across 145 million transactions.
About National Retail Solutions (NRS):
National Retail Solutions operates the largest point-of-sale (POS) terminal-based platform and digital payment processing service for independent retailers nationwide. Retailers utilize NRS offerings to process transactions and effectively manage their businesses. Consumer packaged goods (CPG) suppliers, brokers, analytics firms, and advertisers access the terminal’s digital display network to reach these retailers’ predominantly urban, multi-cultural shopper base, and to harness transaction data-based learnings to identify growth opportunities and measure execution and returns on marketing investment. NRS is a subsidiary of IDT Corporation (NYSE: IDT).
All statements above that are not purely about historical facts, including, but not limited to, those in which we use the words “believe,” “anticipate,” “expect,” “plan,” “intend,” “estimate,” “target” and similar expressions, are forward-looking statements within the meaning of the Private Securities Litigation Reform Act of 1995. While these forward-looking statements represent our current judgment of what may happen in the future, actual results may differ materially from the results expressed or implied by these statements due to numerous important factors. Our filings with the SEC provide detailed information on such statements and risks, and should be consulted along with this release. To the extent permitted under applicable law, IDT assumes no obligation to update any forward-looking statements.
NRSInsights Contact: Brandon Thurber VP, Data Sales & Client Success at NRS National Retail Solutions Brandon.Thurber@nrsplus.com
net2phone’s AI Agent Named a 2025 AI Agent Product of the Year Award Winner
TMCnet award honors net2phone for its innovative solution leveraging artificial intelligence to automate tasks and elevate performance across business functions
Newark, NJ, July 08, 2025 (GLOBE NEWSWIRE) — net2phone, a solutions provider of AI-powered communications-as-a-service, today announced that net2phone’s AI Agent has been named a 2025 AI Agent Product of the Year Award winner by TMCnet, a leading news portal covering trends in communications and technology.
net2phone’s AI Agent utilizes conversational AI and machine learning to provide businesses and organizations with a scalable and cost-effective solution for automating many routine operations across sales, support, and administrative functions. net2phone’s AI Agent does more than answer support inquiries or product questions- it performs tasks such as scheduling appointments and processing orders to accelerate and optimize workflows throughout the organization.
“Our AI Agent drives better bottom-line results by empowering businesses to re-align their work forces,” said Jonah Fink, CEO of net2phone. “AI Agent handles – at scale – routine operations across the enterprise to achieve significant, sustained reductions in operating cost and substantial increases in productivity while freeing employees to focus on higher value challenges. We are delighted that TMCnet has recognized net2phone’s AI Agent’s transformative capabilities with an AI Agent Product of the Year Award.”
TMCnet’s AI Agent Product of the Year Awards recognize groundbreaking products that leverage the power of artificial intelligence to deliver exceptional user experiences, drive significant business impact, and redefine what is possible with AI agents.
“net2phone’s AI Agent incorporates the latest advancements in conversational AI to provide customers with exceptional experiences across voice and text channels and in most widely used languages and dialects,” said Zali Ritholtz, net2phone’s COO. “Our AI Agent not only follows the customer’s business rules and leverages external APIs to handle routine customer questions including order status and product availability inquiries, but it also executes more complex tasks such as managing appointments and processing product returns.”
net2phone is an AI-powered communications solutions provider enabling organizations to analyze and optimize their user experiences with enhanced insight. net2phone’s commitment to delivering reliable and high-quality communications services has earned it a reputation as a leader in both innovation and growth. net2phone is a subsidiary of IDT Corporation (NYSE: IDT). To learn more, please visit net2phone.com or connect on LinkedIn.
NRSInsights’ June 2025 Retail Same-Store Sales Report
June same-store sales increased 3.5% year-over-year
NEWARK, N.J., July 07, 2025 (GLOBE NEWSWIRE) — NRSInsights, a provider of sales data and analytics drawn from retail transactions processed through the National Retail Solutions (NRS) point-of-sale (POS) platform, today announced comparative retail same-store sales results for June 2025.
As of June 30, 2025, the NRS retail network comprised approximately 36,600 active terminals nationwide, scanning purchases at approximately 31,700 independent retailers including convenience stores, bodegas, liquor stores, grocers, and tobacco and sundries sellers, predominantly serving urban consumers.
June Highlights*
(*Same-store sales, unit sales, transactions, and average price data refer to June 2025 and are compared to June 2024 unless otherwise noted. All comparisons are provided on a “per calendar day” basis to remove from consideration variability in the number of days per month or three-month period.)
SALES
Same-store sales increased 3.5% year-over-year. In the previous month (May 2025), same-store sales increased 4.9% year-over-year.
Same-store sales were unchanged compared to the previous month (May 2025). Same-store sales in May 2025 increased 3.8% compared to the previous month (April 2025).
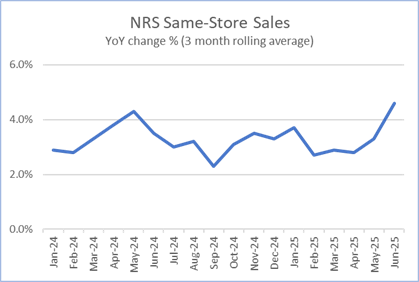
For the three months ended June 30, 2025, same-store sales increased 4.6% compared to the corresponding three months a year ago.
UNITS SOLD
Units sold increased 3.0% year-over-year. In the previous month (May 2025), units sold increased 3.6% year-over-year.
Units sold increased 0.7% compared to the previous month (May 2025). Units sold in May 2025d increased 2.1% compared to the previous month (April 2025).
BASKETS (TRANSACTIONS) PER STORE
Baskets were unchanged year-over-year. In the previous month (May 2025), baskets increased 0.9% year-over-year.
Baskets increased 0.6% compared to the previous month (May 2025). Baskets in May 2025 increased 3.1% compared to the previous month (April 2025).
AVERAGE PRICES
A dollar-weighted average of prices for the top 500 items purchased increased 2.7% year-over-year, a lower rate of increase than the 2.9% year-over-year increase recorded in May 2025.
Retail Trade Comparative Data
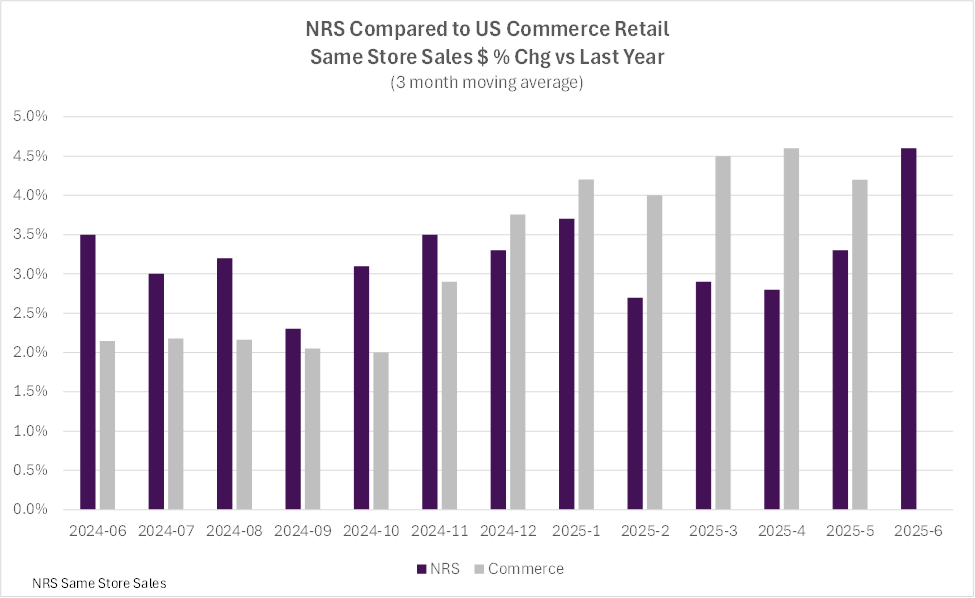
The table below provides historical comparative data with the U.S. Commerce Department’s Advance Monthly Retail Trade same-store sales data excluding food service:
Over the past twelve months, the US Commerce Department’s Advance Monthly Retail Trade data, excluding food services, outpaced the NRS network’s three-month moving average same-store sales by 0.1% on average. In May, the Commerce Department’s three-month rolling average increase exceeded the US Commerce Department’s by 0.9%.
The NRSInsights data in the chart above have not been adjusted to reflect inflation, demographic distributions, seasonal buying patterns, item substitution, days per month, or other factors that may facilitate comparisons to other periods, to other same-store retail sales data, or to the U.S. Commerce Department’s retail data.
Commentary from Brandon Thurber (VP, Data Sales & Client Success at NRS)
“June was another strong month for independent retailers. Same-store dollar sales increased 3.5% versus June 2024, while units increased 3.0%. Moreover, the 3-month rolling average of dollar sales jumped 4.6%, its highest level of year-over-year growth in the past 12 months.
“Much of June’s increase was generated by categories that have recently shown strength -modern oral nicotine, energy drinks, prepared cocktails, and chocolate, which posted a particularly large 8% year-over-year increase.
“While sports drinks, frozen novelties, and bottled water all saw growth over the previous month-likely due to early summer heat-each of these categories declined compared to June 2024, reflecting shifts in baseline demand across traditionally seasonal categories.”
NRSInsights Reports
The NRSInsights monthly Same-Store Retail Sales Reports are intended to provide timely topline data reflective of sales at NRS’ network of independent, predominantly urban, retail stores.
Same-store data comparisons of June 2025 with June 2024 are derived from approximately 220 million transactions processed through the approximately 22,600 stores on the NRS network that scanned transactions in both months. Same-store data comparisons of June 2025 with May 2025 are derived from approximately 277 million transactions processed through approximately 30,600 stores.
Same-store data comparisons for the three months ended June 30, 2025 with the year-ago three months are derived from approximately 624 million scanned transactions processed through those stores that scanned transactions in both three-month periods.
NRS POS Platform
The NRS platform predominantly serves small-format, independent, retail stores nationwide including convenience stores, bodegas, liquor stores, grocers, and tobacco and sundries sellers. These independent retailers operate in all 50 states as well as the District of Columbia, and in 205 of the 210 designated market areas (DMAs) in the United States. During June 2025, NRS’ POS terminals processed $2.1 billion in sales (+15% year-over-year) across 140 million transactions.
About National Retail Solutions (NRS):
National Retail Solutions operates the largest point-of-sale (POS) terminal-based platform and digital payment processing service for independent retailers nationwide. Retailers utilize NRS offerings to process transactions and effectively manage their businesses. Consumer packaged goods (CPG) suppliers, brokers, analytics firms, and advertisers access the terminal’s digital display network to reach these retailers’ predominantly urban, multi-cultural shopper base, and to harness transaction data-based learnings to identify growth opportunities and measure execution and returns on marketing investment. NRS is a subsidiary of IDT Corporation (NYSE: IDT).
All statements above that are not purely about historical facts, including, but not limited to, those in which we use the words “believe,” “anticipate,” “expect,” “plan,” “intend,” “estimate,” “target” and similar expressions, are forward-looking statements within the meaning of the Private Securities Litigation Reform Act of 1995. While these forward-looking statements represent our current judgment of what may happen in the future, actual results may differ materially from the results expressed or implied by these statements due to numerous important factors. Our filings with the SEC provide detailed information on such statements and risks, and should be consulted along with this release. To the extent permitted under applicable law, IDT assumes no obligation to update any forward-looking statements.
NRSInsights Contact: Brandon Thurber VP, Data Sales & Client Success at NRS National Retail Solutions Brandon.Thurber@nrsplus.com
BOSS Money Ranked Highest by Customers Among Money Transfer Companies
Newark, NJ, June 23, 2025 (GLOBE NEWSWIRE) — BOSS Money, the remittance and payments brand of IDT Corporation (NYSE: IDT), achieved the highest average app store rating of the eighteen digital money transfer companies in FXC Intelligence’s 2025 customer satisfaction ranking. FXC Intelligence is a highly regarded financial intelligence and analytics company specializing in cross-border payments.
The BOSS Money app led the pack with a 4.9 average app rating in the FXC Intelligence rankings. Over 100,000 customers across the App store and Google Play platforms have given BOSS Money the highest possible score.
“This recognition reflects the BOSS Money app’s unrivaled ease-of-use and proven reliability,” said Esti Witty, EVP Product at BOSS Money. “Our customers’ feedback, experiences, and trust inspire us to innovate and improve every day.”
The FXC Intelligence app rankings reflect comparative customer scores for money transfer apps in the App Store and Google Play. Boss Money’s 4.6 Trustpilot rating was also among the highest in its peer group.
New BOSS Money customers get two $0-fee transfers on their first two transactions to over 50 countries using a debit card in the BOSS Money app, and five $0-fee transactions when sending money to family or friends in Mexico. BOSS Money is known for its low fees and competitive exchange rates. Within the app, customers can compare foreign exchange rates quoted by leading money transfer providers to see exactly how much they are saving.
“If you have not yet tried the BOSS Money app, this is your invitation. With two $0-fee transfers and the best exchange rates, it is easier than ever to become a happy BOSS Money customer,” Witty emphasized.
The BOSS Money app is free at the iOS App and Google Play Stores.
To learn more about BOSS Money’s low fees, competitive exchange rates and exclusive promotions visit bossmoney.com.
ABOUT BOSS MONEY
BOSS Money’s rapidly expanding international remittance service provides fast, secure and reliable money transfers for residents of the U.S. and Canada to popular destination countries in Latin America, the Caribbean, Africa, and South Asia. BOSS Money offers a robust menu of payout options including cash pick-up, mobile money, in-country bank account, and debit card direct deposit. Customers can remit funds through the highly rated BOSS Money and BOSS Revolution apps or through licensed Boss Money retailers.
ABOUT IDT CORPORATION
IDT Corporation (NYSE: IDT) is a global provider of fintech and communications solutions through a portfolio of synergistic businesses: National Retail Solutions (NRS), through its point-of-sale (POS) platform, enables independent retailers to operate more effectively while providing advertisers and marketers with unprecedented reach into underserved consumer markets; BOSS Money facilitates innovative international remittances and fintech payments solutions; net2phone provides enterprises and organizations with intelligently integrated cloud communications and contact center services across channels and devices; IDT Digital Payments and the BOSS Revolution calling service make sharing prepaid products and services and speaking with friends and family around the world convenient and reliable; and, IDT Global and IDT Express enable communications services to provision and manage international voice and SMS messaging.
All statements above that are not purely about historical facts, including, but not limited to, those in which we use the words “believe,” “anticipate,” “expect,” “plan,” “intend,” “estimate,” “target” and similar expressions, are forward-looking statements within the meaning of the Private Securities Litigation Reform Act of 1995. While these forward-looking statements represent our current judgment of what may happen in the future, actual results may differ materially from the results expressed or implied by these statements due to numerous important factors. Our filings with the SEC provide detailed information on such statements and risks and should be consulted along with this release. To the extent permitted under applicable law, IDT assumes no obligation to update any forward-looking statements.
IDT Corporation to Present at East Coast IDEAS Investor Conference
NEWARK, NJ, June 09, 2025 (GLOBE NEWSWIRE) — IDT Corporation (NYSE: IDT), a provider of fintech and communications solutions, will present at the East Coast IDEAS Investor Conference on Thursday, June 12, 2025 at the Westin Times Square in New York.
Marcelo Fisher, Chief Financial Officer, will provide an overview of IDT’s operations, strategy, and financial results beginning at 3:30 PM Eastern time. Mr. Fischer will also host one-on-one investor meetings throughout the day.
To attend or learn more about the IDEAS conferences, please contact Lacey Wesley at (817) 769 -2373 or lWesley@IDEASconferences.com.
All statements above that are not purely about historical facts, including, but not limited to, those in which we use the words “believe,” “anticipate,” “expect,” “plan,” “intend,” “estimate,” “target” and similar expressions, are forward-looking statements within the meaning of the Private Securities Litigation Reform Act of 1995. While these forward-looking statements represent our current judgment of what may happen in the future, actual results may differ materially from the results expressed or implied by these statements due to numerous important factors. Our filings with the SEC provide detailed information on such statements and risks, and should be consulted along with this release. To the extent permitted under applicable law, IDT assumes no obligation to update any forward-looking statements.
ABOUT IDT CORPORATION
IDT Corporation (NYSE: IDT) is a global provider of fintech and communications solutions through a portfolio of synergistic businesses: National Retail Solutions (NRS), through its point-of-sale (POS) platform, enables independent retailers to operate more effectively while providing advertisers and marketers with unprecedented reach into underserved consumer markets; BOSS Money facilitates innovative international remittances and fintech payments solutions; net2phone provides enterprises and organizations with intelligently integrated cloud communications and contact center services across channels and devices; IDT Digital Payments and the BOSS Revolution calling service make sharing prepaid products and services and speaking with friends and family around the world convenient and reliable; and, IDT Global and IDT Express enable communications services to provision and manage international voice and SMS messaging.
NRSInsights’ May 2025 Retail Same-Store Sales Report
May same-store sales increased 4.9% year-over-year*
NEWARK, N.J., June 09, 2025 (GLOBE NEWSWIRE) — NRSInsights, a provider of sales data and analytics drawn from retail transactions processed through the National Retail Solutions (NRS) point-of-sale (POS) platform, today announced comparative retail same-store sales results for May 2025.
As of May 31, 2025, the NRS retail network comprised approximately 36,000 active terminals nationwide, scanning purchases at approximately 31,300 independent retailers including convenience stores, bodegas, liquor stores, grocers, and tobacco and sundries sellers, predominantly serving urban consumers.
May Highlights*
(*Same-store sales, unit sales, transactions, and average price data refer to May 2025 and are compared to May 2024 unless otherwise noted. All comparisons are provided on a “per calendar day” basis to remove from consideration variability in the number of days per month or three-month period.)
SALES
Same-store sales increased 4.9% year-over-year. In the previous month (April 2025), same-store sales had increased 4.3% year-over-year.
Same-store sales increased 3.8% compared to the previous month (April 2025). Same-store sales in April 2025 had increased 0.6% compared to the previous month (March 2025).
For the three months ended May 31st, 2025, same-store sales increased 3.3% compared to the corresponding three months a year ago.
UNITS SOLD
Units sold increased 3.6% year-over-year. In the previous month (April 2025), units sold had increased 2.5% year-over-year.
Units sold increased 2.1% compared to the previous month (April 2025). Units sold in April 2025 had decreased 0.8% compared to the previous month (March 2025).
BASKETS (TRANSACTIONS) PER STORE
Baskets increased 0.9% year-over-year. In the previous month (April 2025), baskets had increased 1.3% year-over-year.
Baskets increased 3.1% compared to the previous month (April 2025). Baskets in April 2025 had increased 2.7% compared to the previous month (March 2025).
AVERAGE PRICES
A dollar-weighted average of prices for the top 500 items purchased increased 2.9% year-over-year, a higher rate of increase than the 2.3% year-over-year increase recorded in April 2025.
Retail Trade Comparative Data
The table below provides historical comparative data with the U.S. Commerce Department’s Advance Monthly Retail Trade same-store sales data excluding food service:
Over the past twelve months, the NRS network’s three-month moving average same-store sales have outpaced the US Commerce Department’s Advance Monthly Retail Trade data, excluding food services, by 0.1% on average. In April, however, the Department’s three-month rolling average increase exceeded the NRS network’s by 1.8%.
The NRSInsights data in the chart above have not been adjusted to reflect inflation, demographic distributions, seasonal buying patterns, item substitution, days per month, or other factors that may facilitate comparisons to other periods, to other same-store retail sales data, or to the U.S. Commerce Department’s retail data.
Commentary from Brandon Thurber (VP, Data Sales at NRS)
“NRS same-store-sales accelerated in May, increasing 4.9% year-over-year compared to 4.3% last month, with robust year-over-year increases in baskets and units. It is the highest annual rate of increase we have recorded since November. Inflation, as gauged by prices on the largest selling items, also picked up a bit, climbing to 2.9% from 2.3% in April.
“Prepared cocktails ranked among the top categories for absolute dollar growth. Similarly, wine-based cocktails posted strong gains. The two trends within the alcoholic beverage market signal a consumer shift to convenient, flavorful cocktails.
“In the snacking aisle, chocolate defied some of the category headwinds to deliver year-over-year growth. Performance shakes continued their upward trend-driven in part by evolving consumer behaviors and product diversification beyond workout-focused formulations.”
NRSInsights Reports
The NRSInsights monthly Same-Store Retail Sales Reports are intended to provide timely topline data reflective of sales at NRS’ network of independent, predominantly urban, retail stores.
Same-store data comparisons of May 2025 with May 2024 are derived from approximately 223 million transactions processed through the approximately 22,200 stores on the NRS network that scanned transactions in both months. Same-store data comparisons of May 2025 with April 2025 are derived from approximately 271 million transactions processed through approximately 30,200 stores.
Same-store data comparisons for the three months ended May 31, 2025 with the year-ago three months are derived from approximately 617 million scanned transactions processed through those stores that scanned transactions in both three-month periods.
NRS POS Platform
The NRS platform predominantly serves small-format, independent, retail stores nationwide including convenience stores, bodegas, liquor stores, grocers, and tobacco and sundries sellers. These independent retailers operate in all 50 states as well as the District of Columbia, and in 205 of the 210 designated market areas (DMAs) in the United States. During May 2025, NRS’ POS terminals processed $2.1 billion in sales (+18% year-over-year) across 143 million transactions.
About National Retail Solutions (NRS):
National Retail Solutions operates the largest point-of-sale (POS) terminal-based platform and digital payment processing service for independent retailers nationwide. Retailers utilize NRS offerings to process transactions and effectively manage their businesses. Consumer packaged goods (CPG) suppliers, brokers, analytics firms, and advertisers access the terminal’s digital display network to reach these retailers’ predominantly urban, multi-cultural shopper base, and to harness transaction data-based learnings to identify growth opportunities and measure execution and returns on marketing investment. NRS is a subsidiary of IDT Corporation (NYSE: IDT).
All statements above that are not purely about historical facts, including, but not limited to, those in which we use the words “believe,” “anticipate,” “expect,” “plan,” “intend,” “estimate,” “target” and similar expressions, are forward-looking statements within the meaning of the Private Securities Litigation Reform Act of 1995. While these forward-looking statements represent our current judgment of what may happen in the future, actual results may differ materially from the results expressed or implied by these statements due to numerous important factors. Our filings with the SEC provide detailed information on such statements and risks, and should be consulted along with this release. To the extent permitted under applicable law, IDT assumes no obligation to update any forward-looking statements.
NRSInsights Contact: Brandon Thurber VP, Data Sales & Client Success at NRS National Retail Solutions Brandon.Thurber@nrsplus.com