NRSInsights’ February 2026 Retail Same-Store Sales Report
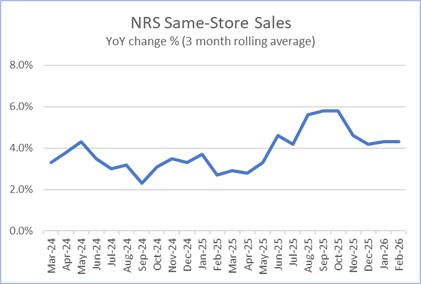
February same-store sales increased 4% year-over-year The average price paid for the top 500 items in February increased 2.7% year-over-year
NEWARK, N.J., March 12, 2026 (GLOBE NEWSWIRE) — NRSInsights, a provider of sales data and analytics drawn from retail transactions processed through the National Retail Solutions (NRS) point-of-sale (POS) platform, today announced comparative retail same-store sales results for February 2026.
As of February 28, 2026, the NRS retail network comprised approximately 38,700 active terminals across 33,600 stores, reflecting the expected normalization from seasonal retailers following the year-end cycle alongside continued year-over-year expansion of the core independent retail base.
February Highlights (Same-store sales, unit sales, transactions, and average price data refer to February 2026 and are compared to February 2025 unless otherwise noted. All comparisons are provided on a “per calendar day” basis to remove from consideration variability in the number of days per month or three-month period.)
SALES
Same-store sales increased 4.0% year-over-year. In the previous month (January 2026), same-store sales increased 5.8% year-over-year.
Same-store sales increased 4.4% compared to the previous month (January 2026). Same-store sales in January 2026 decreased 6.6% compared to the previous month (December 2025). For the three months ended February 28, 2026, same-store sales increased 4.3% compared to the corresponding three months a year ago.
UNITS SOLD
Units sold decreased 0.2% year-over-year. In the previous month (January 2026), units sold increased 2.9% year-over-year.
Units sold increased 2.1% compared to the previous month (January 2025). Units sold in January 2025 decreased 2.2% compared to the previous month (December 2025).
BASKETS (TRANSACTIONS) PER STORE
Baskets decreased 0.8% year-over-year. In the previous month (January 2026), baskets increased 0.3% year-over-year.
Baskets increased 3.7% compared to the previous month (January 2026). Baskets in January 2026 decreased 4.6% compared to the previous month (December 2025).
AVERAGE PRICES
A dollar-weighted average of prices for the top 500 items purchased in February 2026 increased 2.7% year-over-year, more than the 1.2% year-over-year increase in January 2026.
Commentary from Brandon Thurber (VP, Data Sales & Client Success at NRS)
“The trend of steadily increasing year-over-year same-store sales again proved durable in February, increasing 4.0%. The sequential increase – adjusted for the number of days – was comparable at 4.4%.
“Growth was driven by increased sales in key convenience categories, including cigarettes, prepared cocktails, smokeless tobacco, energy beverages, and rolling papers. Some New Years’ resolutions evidently went by the boards quickly this year.
“Gains were particularly large in Midwestern cities including Chicago and Detroit, while sales growth slowed along the East Coast, highlighting the key role that regional factors, including weather, can play in shaping results.
“Our measure of inflation – the average rate of year-over-year price increase for the best-selling items on our network – jumped to 2.7% from 1.2% in January, marking the first increase after four consecutive months of decreases.”
NRSInsights Reports
The NRSInsights monthly Retail Same-Store Sales Reports are intended to provide timely topline data reflective of sales at NRS’ network of independent, predominantly urban, retail stores.
Same-store data comparisons of February 2026 with February 2025 are derived from approximately 196 million transactions processed through the approximately 24,800 stores on the NRS network that scanned transactions in both months. Same-store data comparisons of February 2026 with January 2026 are derived from approximately 247 million transactions processed through approximately 32,500 stores.
Same-store data comparisons for the three months ended February 28, 2026 with the year-ago three months are derived from approximately 605 million transactions processed through those stores that scanned transactions in both three-month periods.
NRS POS Platform The NRS platform predominantly serves small-format, independent, retail stores nationwide including convenience stores, bodegas, liquor stores, grocers, and tobacco and sundries sellers. These independent retailers operate in all 50 states and the District of Colombia, including 205 of the 210 designated market areas (DMAs) in the United States, and in Canada. During February 2026, NRS’ POS terminals processed $1.9 billion in sales (+14% year-over-year) across 122 million transactions.
About National Retail Solutions (NRS): National Retail Solutions operates a leading point-of-sale (POS) terminal-based platform and digital payment processing service for independent retailers nationwide. Retailers utilize NRS offerings to process transactions and effectively manage their businesses. Consumer packaged goods (CPG) suppliers, brokers, analytics firms, and advertisers access the terminal’s digital display network to reach these retailers’ predominantly urban, multi-cultural shopper base, and to harness transaction data-based learnings to identify growth opportunities and measure both execution and returns on marketing investment. NRS is a subsidiary of IDT Corporation (NYSE: IDT).
All statements above that are not purely about historical facts, including, but not limited to, those in which we use the words “believe,” “anticipate,” “expect,” “plan,” “intend,” “estimate,” “target” and similar expressions, are forward-looking statements within the meaning of the Private Securities Litigation Reform Act of 1995. While these forward-looking statements represent our current judgment of what may happen in the future, actual results may differ materially from the results expressed or implied by these statements due to numerous important factors. Our filings with the SEC provide detailed information on such statements and risks, and should be consulted along with this release. To the extent permitted under applicable law, IDT assumes no obligation to update any forward-looking statements.
NRSInsights Contact: Brandon Thurber VP, Data Sales & Client Success at NRS National Retail Solutions Brandon.Thurber@nrsplus.com
IDT Corporation Reports Second Quarter Fiscal Year 2026 Results
Record quarterly gross profit, gross profit margin, Adjusted EBITDA* and Non-GAAP EPS* Income from operations at NRS, Fintech and net2phone segments increased by 12%, 32% and 96%, respectively 1H FY2026 stock repurchases totaled 308K shares for $15 million. IDT increases annual dividend 17% to $0.28
NEWARK, NJ, March 10, 2026 (GLOBE NEWSWIRE) — IDT Corporation (NYSE: IDT), a global provider of fintech and communications solutions, today reported results for the second quarter of its fiscal year 2026, the three months ended January 31, 2026.
2Q26 CONSOLIDATED HIGHLIGHTS
Throughout this release, unless otherwise noted, results for the second quarter of fiscal year 2026 (2Q26) are compared to the second quarter of fiscal year 2025 (2Q25).
(in millions except for shares and per share figures)
2Q26
2Q25
Revenue
+6
%
to
$
320.5
from
$
303.3
Gross Profit
+8
%
to
$
121.3
from
$
112.1
Gross Profit Margin
88 bps
to
37.8
%
from
37.0
%
Income from Operations
(4
)%
to
$
27.2
from
$
28.3
GAAP EPS
+$
0.04
to
$
0.84
from
$
0.80
Non-GAAP EPS*
+$
0.16
to
$
1.00
from
$
0.84
Adjusted EBITDA*
+9
%
to
$
38.0
from
$
34.9
Repurchases of IDT Common Stock (2Q26)
149,000 shares for $7.4
*This release discloses certain Non-GAAP financial measures as well as certain Key Performance Metrics. Please see the explanations of those measures and metrics, the reasons for their inclusion, and reconciliations of non-GAAP measures to their closest GAAP measures, at the end of this release.
REMARKS BY SHMUEL JONAS, CEO
“NRS’, BOSS Money’s and net2phone’s top and bottom-line expansion drove IDT’s strong overall results again this quarter.
“NRS recurring revenue grew year-over-year powered by large increases in Merchant Services and SaaS fee revenues. This quarter, we continued to make progress on initiatives to drive additional Merchant Services and SaaS growth and expand our delivery partnerships. We are also developing offerings for differentiated retailer verticals. Advertising & Data results came in lower than we expected after decreases in CPM rates pressured revenues.
“At BOSS Money, our digital channel continued to outperform relative to the industry, as transactions increased 17% year-over-year. The new federal remittance tax, which applies mainly to transactions originated with cash, went into effect on January 1st. As expected, the tax implementation has accelerated customer migration from the lower-margin retail channel to the higher-margin digital channel, and you will begin to see those positive impacts next quarter.
“net2phone’s bottom line continues to benefit from its strengthening gross margins and operating leverage, and this quarter we also got a boost from favorable foreign exchange rates. Looking ahead, our AI offerings are generating very positive customer reviews and increased spend. Based on these early results, we are readying a new offering – agentic AI seamlessly integrated with unified communications, with a go-to market strategy targeting both direct and channel sales to small-medium businesses.
“Traditional Communications remained a strong cash generator. The segment contributed $19 million in Adjusted EBITDA during the second quarter – a decrease from the year ago quarter but approximately the same as in the prior two quarters.
“Because of our recent strong financial and operational performance, growth outlook, and balance sheet, we again repurchased stock in the second quarter and our Board has increased our annual dividend by 17% to $0.28 per year.”
2Q26 RESULTS BY SEGMENT
National Retail Solutions (NRS)
(In millions except for active POS terminals, payment processing accounts, recurring revenue per terminal, and gross profit margin. Numbers may not foot due to rounding.)
2Q26
1Q26
2Q25
2Q26-2Q25 (%, )
Terminals and payment processing accounts
Active POS terminals
38,900
37,900
34,800
+12
%
Payment processing accounts
28,100
27,300
23,900
+18
%
Recurring revenue
Merchant Services & Other
$
24.0
$
23.8
$
18.1
+32
%
Advertising & Data
$
9.0
$
7.2
$
10.0
(10
)%
SaaS Fees
$
4.4
$
4.2
$
3.5
+26
%
Total recurring revenue
$
37.5
$
35.3
$
31.6
+18
%
POS Terminal Sales
$
1.9
$
1.8
$
1.3
+40
%
Total revenue
$
39.4
$
37.1
$
33.0
+19
%
Monthly average recurring revenue per terminal*
$
325
$
313
$
310
+5
%
Gross profit
$
36.3
$
33.5
$
30.3
+20
%
Gross profit margin
92.2
%
90.2
%
91.8
%
+40
bps
Technology & development
$
2.5
$
2.7
$
2.2
+18
%
SG&A
$
23.5
$
21.9
$
19.0
+24
%
Income from operations
$
10.2
$
8.9
$
9.1
+12
%
Adjusted EBITDA
$
11.8
$
10.3
$
10.3
+15
%
CapEx
$
1.7
$
1.6
$
0.9
+83
%
NRS Take-Aways
•
NRS added approximately 900 net active terminals and 800 net payment processing accounts during 2Q26.
•
The growth of NRS SaaS Fees again outpaced terminal expansion as retailers subscribed to higher-value subscription tiers, including a new premium service tier, and new third-party integrations with popular direct delivery partners DoorDash and Grubhub. Over 30% of NRS’ retail base has now migrated to premium tiers.
•
Merchant Services’ primary revenue growth drivers again included the increase in active payment processing accounts, increased customers’ utilization of credit and debit cards versus cash, and increased same-store sales.
•
NRS’ ‘Rule of 40’ score was 46 in 2Q26, indicating a productive balance between growth and profitability.
BOSS Money and Fintech Segment
(in millions except for average revenue per transaction and gross profit margin)
2Q26
1Q26
2Q26
2Q26-2Q25 (%, )
BOSS Money transactions*
6.4
6.6
5.7
+13
%
Digital channel
5.5
5.5
4.7
+17
%
Retail channel
1.0
1.1
1.0
(4
)%
Fintech segment revenue
BOSS Money
$
36.3
$
38.3
$
33.5
+8
%
Digital channel
$
26.8
$
27.9
$
23.6
+14
%
Retail channel
$
9.5
$
10.4
$
9.9
(5
)%
Other
$
4.9
$
4.4
$
3.3
+48
%
Total Fintech segment revenue
$
41.2
$
42.7
$
36.8
+12
%
Average BOSS Money revenue per transaction*
$
5.63
$
5.80
$
5.87
(4
)%
Fintech segment
Gross profit
$
25.0
$
25.5
$
21.7
+15
%
Gross profit margin
60.6
%
59.8
%
58.9
%
+170
bps
Technology & development
$
2.7
$
2.5
$
2.3
+16
%
SG&A
$
18.2
$
16.7
$
16.3
+12
%
Income from operations
$
4.1
$
6.4
$
3.1
+32
%
Adjusted EBITDA
$
5.6
$
7.5
$
3.9
+44
%
CapEx
$
1.1
$
0.8
$
0.8
+28
%
BOSS Money and Fintech Take-Aways:
•
BOSS Money digital channel send volume* – the amount of principal transferred by BOSS Money customers using the BOSS Money and BOSS Revolution apps – increased by 29% in 2Q26 compared to 2Q25 reflecting increases in both transaction volume and average dollars sent per transaction.
•
The Fintech segment’s year-over-year increases in income from operations and Adjusted EBITDA were driven by BOSS Money’s digital transaction growth, decreases in BOSS Money operating costs per transaction, and by improved economics from other, smaller, businesses within the Fintech segment.
net2phone
(In millions except for seats and gross profit margin. Numbers may not foot due to rounding)
2Q26
1Q26
2Q25
2Q26-2Q25 (%, )
Seats
435
432
410
+6
%
Revenue
Subscription revenue*
$
23.4
$
23.0
$
21.0
+12
%
Other
$
0.4
$
0.4
$
0.5
(7
)%
Total revenue
$
23.9
$
23.5
$
21.5
+11
%
Gross profit
$
19.3
$
18.7
$
17.0
+13
%
Gross profit margin
80.7
%
79.9
%
79.2
%
+150
bps
Technology & development
$
3.1
$
3.0
$
2.8
+11
%
SG&A
$
13.9
$
13.7
$
13.0
+8
%
Income from operations
$
2.2
$
1.9
$
1.1
+96
%
Adjusted EBITDA
$
3.9
$
3.6
$
2.9
+37
%
CapEx
$
1.7
$
1.8
$
1.8
(5
)%
net2phone Take-Aways:
•
Subscription revenue increased 12% year-over-year and gross profit increased 13% year-over-year, reflecting the increase in seats served, augmented by the positive FX impact of strengthening local currencies versus the U.S. dollar in Latin America.
•
net2phone generated substantial year-over-year increases in income from operations and Adjusted EBITDA during 2Q26, benefitting from customer acquisition and operating cost discipline and from increased operating leverage as its business continues to scale.
•
net2phone launched a HIPAA-compatible agentic AI-solution for healthcare providers during 2Q26, and after the quarter close introduced another AI-powered solution specifically geared for the hospitality industry.
Traditional Communications
(In millions except for gross profit margin. Numbers may not foot due to rounding.)
2Q26
1Q26
2Q25
2Q26-2Q25 (%, )
Revenue
IDT Digital Payments
$
104.4
$
107.1
$
101.6
+3
%
BOSS Revolution
$
45.7
$
47.0
$
53.3
(14
)%
IDT Global
$
60.2
$
59.6
$
51.3
+17
%
Other revenue
$
5.8
$
5.8
$
5.9
(1
)%
Total revenue
$
216.1
$
219.5
$
212.0
+2
%
Gross profit
$
40.7
$
40.4
$
43.1
(6
)%
Gross profit margin
18.9
%
18.4
%
20.3
%
(150
)bps
Technology & development
$
5.8
$
5.5
$
5.4
+9
%
SG&A
$
20.3
$
19.0
$
19.4
+5
%
Income from operations
$
14.3
$
15.8
$
18.1
(21
)%
Adjusted EBITDA
$
18.8
$
18.9
$
20.6
(9
)%
CapEx
$
1.6
$
1.5
$
1.2
+32
%
Traditional Communications Take-Aways:
•
Sales on IDT Digital Payments’ Zendit B2B platform more than doubled year-over-year with growth across its mobile top-up, prepaid gift card and e-sim verticals.
•
The decrease in the overall segment’s gross profit primarily reflects a revenue mix shift at IDT Global, because of an increase in sales traffic to lower margin corridors.
OTHER FINANCIAL RESULTS
Consolidated results for all periods presented include corporate overhead. Corporate G&A expense decreased 7% to $2.8 million in 2Q26 from $3.0 million in 2Q25.
As of January 31, 2026, IDT held $246.2 million in cash, cash equivalents, debt securities, and current equity investments, exclusive of restricted cash. Also as of January 31, 2026, current assets totaled $572.8 million and current liabilities totaled $308.4 million. IDT had no outstanding debt at the quarter end.
Net cash provided by operating activities in 2Q26 was $38.3 million compared to $20.2 million in 2Q25. Exclusive of changes in customer funded deposits at IDT’s Fintech segment businesses, adjusted net cash provided by operating activities* in 2Q26 was $39.3 million compared to $7.3 million provided in 2Q25.
Capital expenditures increased to $6.1 million in 2Q26 from $4.8 million in 2Q25.
FY 2026 FINANCIAL OUTLOOK
IDT is increasing its previous FY 2026 guidance for consolidated Adjusted EBITDA from $141-$145 million to $147-$149 million. At the midpoint, the updated guidance represents an increase of 12% from FY 2025 Adjusted EBITDA of $131.7 million.
Reconciliations of Adjusted EBITDA to net income and income from operations for all periods presented are included in the Non-GAAP reconciliations provided at the end of this release.
DIVIDEND
The Board of Directors of IDT Corporation increased IDT’s annual dividend from $0.24 to $0.28 and declared a quarterly cash dividend of $0.07 per share of IDT Class A and Class B Common stock payable on March 31, 2026 to stockholders of record as of March 19, 2026.
IDT EARNINGS ANNOUNCEMENT INFORMATION
This release is available for download in the “Investors & Media” section of the IDT Corporation website (https://www.idt.net/investors-and-media) and has been filed on a current report (Form 8-K) with the SEC.
IDT will host an earnings conference call beginning at 5:30 PM Eastern today with management’s discussion of results followed by Q&A with investors. To listen to the call and participate in the Q&A, dial 1-888-506-0062 (toll-free from the U.S.) or 1-973-528-0011 (international) and provide the following access code: 838615.
A replay of the conference call will be available approximately three hours after the call concludes through Tuesday, March 24, 2026. To access the call replay, dial 1-877-481-4010 (toll-free from the U.S.) or 1-919-882-2331 (international) and provide this replay passcode: 53592. The replay will also be accessible via streaming audio at the IDT investor relations website.
ABOUT IDT CORPORATION
IDT Corporation (NYSE: IDT) is a global provider of fintech and communications solutions through a portfolio of synergistic businesses: National Retail Solutions‘ (NRS) point-of-sale (POS) platform enables independent retailers to operate more effectively while providing advertisers and marketers with reach into underserved consumer markets; BOSS Money facilitates innovative international remittances and fintech payments solutions; net2phone provides businesses with unified communications, customer experience, and AI-driven workflow solutions; IDT Digital Payments and the BOSS Revolution calling service make sharing prepaid products and services and speaking with friends and family around the world convenient and reliable; and, IDT Global and IDT Express enable communications services to provision and manage international voice and SMS messaging.
All statements above that are not purely about historical facts, including, but not limited to, those in which we use the words “believe,” “anticipate,” “expect,” “plan,” “intend,” “estimate,” “target” and similar expressions, are forward-looking statements within the meaning of the Private Securities Litigation Reform Act of 1995. While these forward-looking statements represent our current judgment of what may happen in the future, actual results may differ materially from the results expressed or implied by these statements due to numerous important factors. Our filings with the SEC provide detailed information on such statements and risks and should be consulted along with this release. To the extent permitted under applicable law, IDT assumes no obligation to update any forward-looking statements.
Trade accounts receivable, net of allowance for credit losses of $10,190 at January 31, 2026 and $9,097 at July 31, 2025
42,717
44,932
Settlement assets, net of reserve of $1,799 at January 31, 2026 and $1,367 at July 31, 2025
69,315
28,014
Disbursement prefunding
45,598
37,097
Prepaid expenses
11,588
12,440
Other current assets
30,659
28,702
Total current assets
572,800
520,303
Property, plant, and equipment, net
40,865
38,869
Goodwill
26,639
26,488
Other intangibles, net
4,476
5,056
Equity investments
5,179
6,658
Operating lease right-of-use assets
1,455
1,878
Deferred income tax assets, net
18,678
18,790
Other assets
8,199
8,161
Total assets
$
678,291
$
626,203
Liabilities, redeemable noncontrolling interest, and equity
Current liabilities:
Trade accounts payable
$
16,648
$
19,435
Accrued expenses
90,030
97,295
Deferred revenue
27,022
27,726
Customer funds deposits
128,105
114,708
Settlement liabilities
18,547
13,922
Other current liabilities
28,059
19,910
Total current liabilities
308,411
$
292,996
Operating lease liabilities
753
1,103
Other liabilities
923
1,688
Total liabilities
310,087
295,787
Commitments and contingencies
Redeemable noncontrolling interest
11,854
11,459
Equity:
IDT Corporation stockholders’ equity:
Preferred stock, $.01 par value; authorized shares-10,000; no shares issued
–
–
Class A common stock, $.01 par value; authorized shares-35,000; 3,272 shares issued and 1,574 shares outstanding at January 31, 2026 and July 31, 2025
33
33
Class B common stock, $.01 par value; authorized shares-200,000; 28,537 and 28,528 shares issued and 23,357 and 23,656 shares outstanding at January 31, 2026 and July 31, 2025, respectively
285
285
Additional paid-in capital
315,053
308,111
Treasury stock, at cost, consisting of 1,698 and 1,698 shares of Class A common stock and 5,179 and 4,872 shares of Class B common stock at January 31, 2026 and July 31, 2025, respectively
(158,892
)
(143,853
)
Accumulated other comprehensive loss
(14,156
)
(16,569
)
Retained earnings
197,416
157,124
Total IDT Corporation stockholders’ equity
339,739
305,131
Noncontrolling interests
16,611
13,826
Total equity
356,350
318,957
Total liabilities, redeemable noncontrolling interest, and equity
$
678,291
$
626,203
IDT CORPORATION CONDENSED CONSOLIDATED STATEMENTS OF INCOME (Unaudited)
Three Months Ended January 31,
Six Months Ended January 31,
2026
2025
2026
2025
(in thousands, except per share data)
Revenues
$
320,516
$
303,349
$
643,268
$
612,915
Direct cost of revenues
199,239
191,239
403,812
393,178
Gross profit
121,277
112,110
239,456
219,737
Operating expenses:
Selling, general and administrative
78,846
70,721
152,853
141,772
Technology and development
14,123
12,612
27,754
25,372
Severance
227
233
431
410
Other operating expense, net
836
227
247
227
Total operating expenses
94,032
83,793
181,285
167,781
Income from operations
27,245
28,317
58,171
51,956
Interest income, net
1,640
1,354
3,348
2,782
Other income (expense), net
186
207
(281
)
(76
)
Income before income taxes
29,071
29,878
61,238
54,662
Provision for income taxes
(6,247
)
(7,665
)
(14,318
)
(13,967
)
Net income
22,824
22,213
46,920
40,695
Net income attributable to noncontrolling interests
(1,876
)
(1,944
)
(3,610
)
(3,178
)
Net income attributable to IDT Corporation
$
20,948
$
20,269
$
43,310
$
37,517
Earnings per share attributable to IDT Corporation common stockholders:
Basic
$
0.84
$
0.81
$
1.72
$
1.49
Diluted
$
0.84
$
0.80
$
1.72
$
1.48
Weighted-average number of shares used in calculation of earnings per share:
Basic
25,048
25,161
25,115
25,182
Diluted
25,055
25,324
25,124
25,343
Stock-based compensation included in total operating expenses
$
4,348
$
863
$
6,362
$
1,774
IDT CORPORATION
CONDENSED CONSOLIDATED STATEMENTS OF CASH FLOWS (Unaudited)
Six Months Ended January 31,
2026
2025
(in thousands)
Operating activities
Net income
$
46,920
$
40,695
Adjustments to reconcile net income to net cash provided by operating activities:
Depreciation and amortization
10,698
10,490
Deferred income taxes
85
12,674
Provision for credit losses, doubtful accounts receivable, and reserve for settlement assets
2,372
2,472
Stock-based compensation
6,361
1,774
Other
1,971
1,077
Changes in assets and liabilities:
Trade accounts receivable
761
(4,271
)
Settlement assets and disbursement prefunding
(50,261
)
(47,262
)
Prepaid expenses, other current assets, and other assets
961
311
Trade accounts payable, accrued expenses, settlement liabilities, other current liabilities, and other liabilities
68
(11,844
)
Customer funds deposits
9,587
15,701
Deferred revenue
(1,343
)
(1,500
)
Net cash provided by operating activities
28,180
20,317
Investing activities
Capital expenditures
(11,969
)
(10,100
)
Purchase of equity investments
(500
)
–
Purchase of convertible preferred stock in equity method investment
–
(673
)
Purchases of debt and equity securities
(26,319
)
(15,997
)
Proceeds from maturities and sales of debt and equity securities
17,354
16,751
Net cash used in investing activities
(21,434
)
(10,019
)
Financing activities
Dividends paid
(3,018
)
(2,524
)
Distributions to noncontrolling interests
(50
)
(50
)
Proceeds from borrowings under revolving credit facility
15,987
24,534
Repayment of borrowings under revolving credit facility
(15,987
)
(24,534
)
Proceeds from borrowings
125
–
Repayment of borrowings
(100
)
–
Proceeds from exercise of stock options
200
–
Repurchases of Class B common stock
(15,039
)
(11,395
)
Net cash used in financing activities
(17,882
)
(13,969
)
Effect of exchange rate changes on cash, cash equivalents, and restricted cash and cash equivalents
6,232
(4,079
)
Net decrease in cash, cash equivalents, and restricted cash and cash equivalents
(4,904
)
(7,750
)
Cash, cash equivalents, and restricted cash and cash equivalents at beginning of period
341,832
255,456
Cash, cash equivalents, and restricted cash and cash equivalents at end of period
$
336,928
$
247,706
Supplemental Cash Flow Information
Cash paid during the period for:
Income taxes
$
7,000
$
–
Non-Cash Financing Activities
Shares of the Company’s Class B common stock issued to an executive officer for bonus payment
$
–
$
1,824
Value of the Company’s DSUs exchanged for National Retail Solutions shares
$
3,547
$
–
Reconciliation of Non-GAAP Financial Measures for the Second Quarter Fiscal 2026 and 2025
In addition to disclosing financial results that are determined in accordance with generally accepted accounting principles in the United States of America (GAAP), IDT also disclosed (a) Adjusted EBITDA for 2Q26, 1Q26, and 2Q25, among other quarters (b) non-GAAP earnings per diluted share (Non-GAAP EPS) for 2Q26 and 2Q25 (c) NRS’ ‘Rule of 40’ score for 2Q26 and (d) non-GAAP adjusted net cash provided by or used in operating activities for 2Q26 and 2Q25. These are non-GAAP financial measures intended to provide useful information that supplements IDT’s or the relevant segment’s results in accordance with GAAP. The following explains these terms and their respective reconciliations to the most directly comparable GAAP measures.
Generally, a non-GAAP measure is a numerical measure of a company’s performance, financial position, or cash flows that either excludes or includes amounts that are not normally excluded or included in the most directly comparable measure calculated and presented in accordance with GAAP.
IDT’s measure of Adjusted EBITDA starts with net income from operations in accordance with GAAP and adds depreciation and amortization, severance expense, stock-based compensation, and other operating expenses, and deducts other operating income.
IDT’s measure of Non-GAAP EPS is calculated by dividing non-GAAP net income by the diluted weighted-average shares. IDT’s measure of non-GAAP net income starts with net income attributable to IDT in accordance with GAAP and adds severance expense, stock-based compensation, and other operating expenses, and deducts other operating income. These additions and subtractions are non-cash and/or non-routine items in the relevant fiscal 2026 and fiscal 2025 periods.
Management believes that IDT’s Adjusted EBITDA and Non-GAAP EPS are measures which provide useful information to both management and investors by excluding certain expenses and non-routine gains and losses that may not be indicative of IDT’s or the relevant segment’s core operating results. Management uses Adjusted EBITDA, among other measures, as a relevant indicator of core operational strengths in its financial and operational decision making. In addition, management uses Adjusted EBITDA and Non-GAAP EPS to evaluate operating performance in relation to IDT’s competitors. Disclosure of these financial measures may be useful to investors in evaluating performance and allow for greater transparency of the underlying supplemental information used by management in its financial and operational decision-making. In addition, IDT has historically reported similar financial measures and believes such measures are commonly used by readers of financial information in assessing performance, therefore the inclusion of comparative numbers provides consistency in financial reporting.
Management refers to Adjusted EBITDA, as well as the GAAP measures income (loss) from operations and net income, on a segment and/or consolidated level to facilitate internal and external comparisons to the segments’ and IDT’s historical operating results, in making operating decisions, for budget and planning purposes, and to form the basis upon which management is compensated.
While depreciation and amortization are considered operating costs under GAAP, these expenses primarily represent the non-cash current period allocation of costs associated with long-lived assets acquired or capitalized in prior periods. IDT’s Adjusted EBITDA, which is exclusive of depreciation and amortization, is a useful indicator of its current performance.
Severance expense is excluded from the calculation of Adjusted EBITDA and Non-GAAP EPS. Severance expense is reflective of decisions made by management in each period regarding the aspects of IDT’s and its segments’ businesses to be focused on in light of changing market realities and other factors. While there may be similar charges in other periods, the nature and magnitude of these charges can fluctuate markedly and do not reflect the performance of IDT’s core and continuing operations.
Other operating income (expense), net, which is a component of income (loss) from operations, is excluded from the calculation of Adjusted EBITDA and Non-GAAP EPS. Other operating expense, net primarily includes legal fees net of insurance claims related to Straight Path Communications Inc.’s stockholders’ class action, legal settlements, and gains from the write-off of contingent consideration liabilities. From time-to-time, IDT may have gains or incur costs related to non-routine legal, tax, and other matters, however, these various items generally do not occur each quarter. IDT believes the gain and losses from these non-routine matters are not components of IDT’s or the relevant segment’s core operating results.
Stock-based compensation recognized by IDT and other companies may not be comparable because of the variety of types of awards as well as the various valuation methodologies and subjective assumptions that are permitted under GAAP. Stock-based compensation is excluded from IDT’s calculation of Adjusted EBITDA and Non-GAAP EPS because management believes this allows investors to make more meaningful comparisons of the operating results per share of IDT’s core business with the results of other companies. Stock-based compensation continues to be a significant expense for IDT and an important part of employees’ compensation that impacts their performance.
Adjusted EBITDA and Non-GAAP EPS should be considered in addition to, not as a substitute for, or superior to, income (loss) from operations, cash flow from operating activities, net income, basic and diluted earnings per share or other measures of liquidity and financial performance prepared in accordance with GAAP. In addition, IDT’s measurements of Adjusted EBITDA and Non-GAAP EPS may not be comparable to similarly titled measures reported by other companies.
The ‘Rule of 40’ score is a metric used to evaluate the performance of SaaS providers. It postulates that a SaaS provider’s revenue growth rate plus its EBITDA margin should equal or exceed 40 percent. The ‘Rule of 40’ is typically used to assess a company’s balance between growth and profitability. A total of over 40 is thought to indicate a healthy combination of expansion and financial stability, making it a useful tool for management and investors to gauge the potential for long-term success and make informed decisions about resource allocation and business strategy.
NRS’ ‘Rule of 40′ score is computed by adding (a) the growth rate of NRS’ recurring revenue for the relevant period compared to the corresponding year ago period to (b) NRS’ Adjusted EBITDA margin for the twelve-month period through the end of the current period. NRS’ recurring revenue is calculated by subtracting NRS’ revenue from POS terminal sales from its total GAAP revenue. Adjusted EBITDA is a non-GAAP measure as discussed above. Adjusted EBITDA margin is calculated by dividing Adjusted EBITDA by GAAP revenue for the relevant period.
IDT’s Non-GAAP adjusted measure of net cash provided by operating activities is calculated by excluding the impact of changes in customer funds deposits held from net cash provided by operating activities. Customer funds deposits represent, for the most part, funds loaded by customers of the various prepaid debit card programs issued under IDT’s wholly-owned back in Gibraltar. As such, these funds are held for customers and are not available for use by the Company. This adjusted measure of net cash provided by operating activities provides a more meaningful measure of the cash generated by our core business operations, making it a more useful tool for management and investors to evaluate the cash generation of our business operations, and to compare IDT’s cash generation with companies that do not have, or have different levels of, customer deposits. Customer deposits are, by regulation, not available to fund IDT’s operating activities.
Following are reconciliations of Adjusted EBITDA and Non-GAAP EPS to the most directly comparable GAAP measure, which are, (a) for Adjusted EBITDA, (i) income (loss) from operations for IDT’s reportable segments and (ii) net income for IDT on a consolidated basis, and (b) for Non-GAAP EPS, diluted earnings per share. Also following is NRS’ ‘Rule of 40′ score computation including the reconciliation of NRS’ Adjusted EBITDA to the most directly comparable GAAP measure, NRS’ income from operations, and IDT’s Non-GAAP adjusted measure of net cash provided by operating activities reconciled to GAAP net cash provided by operating activities.
IDT Corporation Reconciliation of Net Income to Adjusted EBITDA for the three months ended 2Q26, 1Q26, and 2Q25 (unaudited) in millions. Figures may not foot or cross-foot due to rounding
Total IDT Corporation
Traditional Comm.
net2phone
NRS
Fintech
Corporate
Three Months Ended January 31, 2026 (2Q26)
Net income attributable to IDT Corporation
$
20.9
Adjustments:
Net income attributable to noncontrolling interests
$
(1.9
)
Net income
$
22.8
Provision for income taxes
$
(6.2
)
Income before income taxes
$
29.1
Interest income, net
$
1.6
Other expense, net
$
0.2
Income (loss) from operations
$
27.2
$
14.3
$
2.2
$
10.2
$
4.1
$
(3.5
)
Depreciation and amortization
$
5.4
$
1.8
$
1.7
$
1.2
$
0.8
$
0.0
Stock-based compensation
$
4.3
$
2.4
$
0.0
$
0.4
$
0.8
$
0.7
Other operating expense, net
$
0.8
$
0.2
$
0.0
$
0.0
$
0.0
$
0.7
Severance expense
$
0.2
$
0.1
$
0.1
$
0.0
$
0.0
$
0.0
Adjusted EBITDA
$
38.0
$
18.8
$
3.9
$
11.8
$
5.6
$
(2.1
)
Total IDT Corporation
Traditional Comm.
net2phone
NRS
Fintech
Corporate
Three Months Ended October 31, 2025 (1Q26)
Net income attributable to IDT Corporation
$
22.4
Adjustments:
Net income attributable to noncontrolling interests
$
(1.7
)
Net income
$
24.1
Provision for income taxes
$
(8.1
)
Income before income taxes
$
32.2
Interest income, net
$
1.7
Other expense, net
$
(0.5
)
Income (loss) from operations
$
30.9
$
15.8
$
1.9
$
8.9
$
6.4
$
(2.2
)
Depreciation and amortization
$
5.3
$
1.8
$
1.6
$
1.1
$
0.7
$
0.0
Stock-based compensation
$
2.0
$
1.1
$
0.0
$
0.2
$
0.3
$
0.3
Other operating income, net
$
(0.6
)
$
(0.1
)
$
0.0
$
0.0
$
0.0
$
(0.5
)
Severance expense
$
0.2
$
0.1
$
0.0
$
0.0
$
0.0
$
0.0
Adjusted EBITDA
$
37.9
$
18.9
$
3.6
$
10.3
$
7.5
$
(2.4
)
Three Months Ended January 31, 2025 (2Q25)
Net income attributable to IDT Corporation
$
20.3
Adjustments:
Net income attributable to noncontrolling interests
$
(1.9
)
Net income
$
22.2
Provision for income taxes
$
(7.7
)
Income before income taxes
$
29.9
Interest income, net
$
1.4
Other expense, net
$
0.2
Income (loss) from operations
$
28.3
$
18.1
$
1.1
$
9.1
$
3.1
$
(3.1
)
Depreciation and amortization
$
5.2
$
1.9
$
1.6
$
1.0
$
0.8
$
0.0
Stock-based compensation
$
0.9
$
0.3
$
0.0
$
0.2
$
0.1
$
0.3
Other operating income, net
$
0.2
$
0.0
$
0.2
$
0.0
$
0.0
$
0.0
Severance expense
$
0.2
$
0.2
$
0.0
$
0.0
$
0.0
$
0.0
Adjusted EBITDA
$
34.9
$
20.6
$
2.9
$
10.3
$
3.9
$
(2.8
)
IDT Corporation Reconciliation of Earnings Per Share (EPS) to Non-GAAP EPS for 2Q26 and 2Q25 (unaudited) in millions, except for per share data. Figures may not foot due to rounding
2Q26
2Q25
Net income attributable to IDT Corporation
$
20.9
$
20.3
Adjustments (add) subtract:
Stock-based compensation
(4.3
)
(0.9
)
Severance expense
(0.2
)
(0.2
)
Other operating income, net
(0.8
)
(0.2
)
Total adjustments
(5.4
)
(1.3
)
Income tax effect of total adjustments
(1.3
)
(0.3
)
4.1
1.0
Non-GAAP net income
$
25.0
$
21.3
Earnings per share:
Basic
$
0.84
$
0.81
Total adjustments
0.16
0.03
Non-GAAP – basic
$
1.00
$
0.84
Weighted-average number of shares used in calculation of basic earnings per share
25.0
25.2
Diluted
$
0.84
$
0.80
Total adjustments
0.16
0.04
Non-GAAP – diluted
$
1.00
$
0.84
Weighted-average number of shares used in calculation of diluted earnings per share
25.1
25.3
IDT Corporation NRS’ ‘Rule of 40’ Score For 2Q26 (unaudited) in millions. Figures may not foot due to rounding
Trailing twelve months (TTM)
3Q25
4Q25
1Q26
2Q26
2Q26
Reconciliation of NRS’ Income from Operations to Adjusted EBITDA
Income from operations
$
6.2
$
5.8
$
8.9
$
10.2
$
31.1
Depreciation and amortization
1.0
1.1
1.1
1.2
4.4
Stock-based compensation
0.6
0.2
0.2
0.4
1.4
Other operating expense, net
0.0
2.4
0.0
0.0
2.4
Adjusted EBITDA
$
7.8
$
9.5
$
10.3
$
11.8
$
39.4
2Q26
2Q25
NRS’ ‘Rule of 40’ Score
NRS recurring revenue
$
37.5
$
31.6
NRS other revenue
1.9
1.3
NRS total revenue
$
39.3
$
33.0
NRS recurring revenue growth rate
18
%
NRS TTM Adjusted EBITDA (from above)
$
39.4
NRS TTM total revenue
141.9
NRS TTM Adjusted EBITDA margin
28
%
Rule of 40 score
46
%
IDT Corporation Adjusted net cash provided by operating activities for 2Q26 and 2Q25 (unaudited) in millions. Figures may not foot due to rounding
(in millions)
Three months ended January 31st
2Q26
2Q25
Net cash provided by operating activities (GAAP)
$
38.3
$
20.2
Changes in customer deposits
$
(1.0
)
$
12.9
Adjusted net cash provided by operating activities
$
39.3
$
7.3
Explanation of Key Performance Metrics
net2phone Subscription Revenue is calculated by subtracting net2phone’s equipment revenue and revenue generated by a legacy SIP trunking offering in Brazil from its revenue in accordance with GAAP. net2phone’s cloud communications and contact center offerings are priced on a per-seat basis, with customers paying based on the number of users in their organization. The number of seats served and subscription revenue trends and comparisons between periods are used in the analysis of net2phone’s revenues and direct cost of revenues and are strong indications of the top-line growth and performance of the business.
NRS’ Monthly Average Recurring Revenue per Terminal is calculated by dividing NRS’ recurring revenue as defined in the Reconciliation of Non-GAAP Financial Measures by the average number of active POS terminals during the period. The average number of active POS terminals is calculated by adding the beginning and ending number of active POS terminals during the period and dividing by two. NRS’ recurring revenue divided by the average number of active POS terminals is divided by three when the period is a fiscal quarter. Recurring Revenue and Monthly Average Recurring Revenue per Terminal are useful for comparisons of NRS’ revenue and revenue per customer to prior periods and to competitors and others in the market, as well as for forecasting future revenue from the customer base.
BOSS Money Transactions are a nonfinancial metric that measures customer usage during a reporting period. Average BOSS Money Revenue per Transaction measures the revenue productivity of BOSS Money’s remittance business. It is calculated by dividing BOSS Money revenue during the period by the number of transactions. Average BOSS Money Revenue per Transaction is a key metric for evaluating the productivity and operational performance of the business. BOSS Money’s Digital Send Volume is the aggregate amount of principal remitted by BOSS Money’s digital customers – those using the BOSS Money and BOSS Revolutions apps to originate remittances. Digital Send Volume is a key metric for evaluating the operational performance of the digital channel of the remittance business, and for comparing the performance of BOSS Money’s digital channel to competitors in the remittance business as well as to performance to other temporal periods.
# # #
IDT Corporation to Report Second Quarter Fiscal Year 2026 Results
NEWARK, N.J., Feb. 25, 2026 (GLOBE NEWSWIRE) — IDT Corporation (NYSE: IDT), a global provider of fintech and communications solutions, has scheduled its report of financial and operational results for the second quarter fiscal year 2026 (the three months ended January 31, 2026) on Tuesday, March 10, 2026.
IDT’s earnings release will be issued and posted on the IDT investor relations website (https://www.idt.net/investors-and–media) at approximately 4:30 PM Eastern.
IDT will host an earnings conference call beginning at 5:30 PM Eastern with management’s discussion of results followed by Q&A with investors. To listen to the call and participate in the Q&A, dial 1-888-506-0062 (toll-free from the US) or 1-973-528-0011 (international) and provide the following access code: 838615.
A replay of the conference call will be available approximately three hours after the call concludes through March 24, 2026. To access the call replay, dial 1-877-481-4010 (toll-free from the US) or 1-919-882-2331 (international) and provide this replay passcode: 53592. The replay will also be accessible via streaming audio at the IDT investor relations website.
ABOUT IDT CORPORATION IDT Corporation (NYSE: IDT) is a global provider of fintech and communications solutions through a portfolio of synergistic businesses: National Retail Solutions‘ (NRS) point-of-sale (POS) platform enables independent retailers to operate more effectively while providing advertisers and marketers with reach into underserved consumer markets; BOSS Money facilitates innovative international remittances and fintech payments solutions; net2phone provides businesses with unified communications, customer experience, and AI-driven workflow solutions; IDT Digital Payments and the BOSS Revolution calling service make sharing prepaid products and services and speaking with friends and family around the world convenient and reliable; and, IDT Global and IDT Express enable communications services to provision and manage international voice and SMS messaging.
net2phone Launches Integrated Communications for Hospitality Providers
net2phone’s Powerful Hospitality Solution Integrates with Most Popular Property Management Systems
NEWARK, N.J., Feb. 19, 2026 (GLOBE NEWSWIRE) — net2phone, a global leader in cloud communications and customer-engagement solutions, today introduced an enhanced communications solution for the hospitality industry.
net2phone’s cloud-native voice, video, and messaging capabilities synchronize in real time with many popular property management system (PMS) platforms for unified reporting and streamlined workflows.
“We’re very excited to offer the hospitality industry an exceptionally powerful solution that will dramatically elevate the quality and efficiency of their operations,” said Jonah Fink, President at net2phone. “Through our solution, hoteliers benefit from fully integrated communications – driving enhanced staff productivity, more responsive and efficient workflows, and, ultimately, a better guest experience.”
Key benefits of the net2phone hospitality solution include:
Realtime PMS + cloud PBX integration: A live connection between the hotel PMS and net2phone’s cloud PBX keeps guest data, room status, billing, and call activity secure and aligned across front desk, housekeeping, and back-office teams.
Automated, guest-centric workflows: Guest events such as check-in, room changes, and check-out automatically trigger services including wake-up calls, voicemail setup, messaging, and phone access, enabling staff to focus on enhancing and personalizing the guest experience.
Accurate call accounting and billing integration: Call detail records flow seamlessly from the PBX to the PMS, applying flexible billing rules and posting charges directly to the guest folio for cleaner invoices and reduced revenue leakage.
Centralized control of voice services: Hotel staff across departments can manage room status updates, minibar charges, class-of-service, voicemail, Do Not Disturb, and wake-up calls from a single platform accessible through web and mobile to improve coordination and speed room readiness.
To further maximize efficiency and automate workflows, net2phone’s AI Agent integrates with its hospitality communications solution to automate front desk operations and enhance customer service. net2phone AI gracefully handles these hospitality tasks and more:
Assists guests with booking rooms;
Answers FAQs and coordinates across departments as needed;
Welcomes website visitors, answers questions instantly, and guides guests exactly to what they need.
For more information about the net2phone’s hospitality solution, or to schedule a demo, please visit net2phone.com/hospitality.
About net2phone: net2phone’s innovative AI-powered communications and task execution help businesses around the globe succeed through smarter conversations, automated workflows, and enhanced insight. net2phone’s commitment to delivering reliable and high-quality communications services has earned it a reputation as a leader in both innovation and growth. net2phone is a subsidiary of IDT Corporation (NYSE: IDT). To learn more, please visit net2phone.com or connect on LinkedIn.
net2phone Media Contact: Denise D’Arienzo VP of Marketing & Sales Operations Email: denise.darienzo@net2phone.com
BOSS Money App Helps Senders Avoid the New 1% Remittance Tax
NEWARK, N.J., Feb. 12, 2026 (GLOBE NEWSWIRE) — A new federal excise tax on international money transfers funded with cash, money orders, or cashier’s checks went into effect on January 1, 2026. The cost of this tax, 1% of the amount transferred, will add up quickly for the millions of U.S. money transfer consumers who rely on international remittances to support loved ones overseas.
Fortunately, the BOSS Money international money transfer app enables customers to avoid the tax. BOSS Money is the remittance and payments brand of IDT Corporation (NYSE: IDT)
A Smart Way to Avoid the Tax: Go Digital
Because the tax applies only to transfers paid with cash or similar instruments but not to transactions funded with a debit card or bank account (ACH), customers can use the BOSS Money app to send money abroad without paying this new tax.
“The BOSS Money app has always made sharing with family and friends affordable,” said Michelle Rendo, head of marketing for BOSS Money. “If you don’t want to pay the new remittance tax, we invite you to try the BOSS Money app to send money transfers funded with your debit card or bank account.”
A Trusted, Cost-Smart Alternative
The BOSS Money app combines low rates, transparent pricing, and secure technology to offer a superior user experience with advanced features including:
Debit and bank account (ACH) funded transfers to more than 50 countries;
Transparent pricing with live fee and exchange-rate previews;
Fast delivery options – often within minutes;
Secure, encrypted transactions with fraud alerts, Face ID, and passcode login;
Real-time transfer tracking with updates for both the sender and recipient;
Multiple payout options including cash pick-up, mobile money, and in-country direct deposit to bank account and debit cards;
Bilingual English/Spanish support;
Refer-a-Friend program providing $25 rewards for successful referrals.
BOSS Money is consistently ranked among the highest-rated money transfer services with more than 110,000 five-star reviews, in total, on Google Play and the Apple App Store. In June 2025, FXC Intelligence named BOSS Money the top-rated money transfer app with a near-perfect 4.9 score.
About BOSS Money: BOSS Money’s rapidly expanding international remittance service provides fast, secure and reliable money transfers for residents of the U.S. and Canada to popular destination countries in Latin America, the Caribbean, Africa, and South Asia. BOSS Money offers a robust menu of payout options including cash pick-up, mobile money, in-country bank account, and debit card direct deposit. Customers can remit funds through WhatsApp, the highly rated BOSS Money and BOSS Revolution apps, or through licensed Boss Money retailers. BOSS money is the remittance and payments brand of IDT Corporation (NYSE: IDT).
Contact: IDT Corporation Investor Relations Bill Ulrey william.ulrey@idt.net
# # #
NRSInsights’ January 2026 Retail Same-Store Sales Report
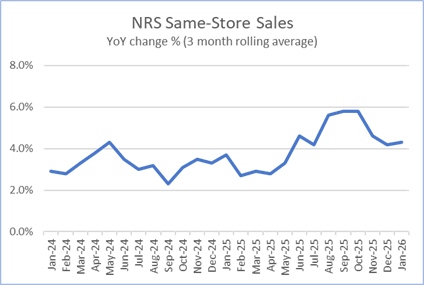
January same-store sales increased 5.8% year-over-year The average price paid for the top 500 items in January increased 1.2% year-over-year
NEWARK, N.J., Feb. 10, 2026 (GLOBE NEWSWIRE) — NRSInsights, a provider of sales data and analytics drawn from retail transactions processed through the National Retail Solutions (NRS) point-of-sale (POS) platform, today announced comparative retail same-store sales results for January 2026.
As of January 31, 2026, the NRS retail network comprised approximately 38,900 active terminals nationwide, scanning purchases at approximately 33,500 independent retailers, including convenience stores, bodegas, liquor stores, grocers, and tobacco and sundries sellers, predominantly serving urban consumers.
January Highlights
(Same-store sales, unit sales, transactions, and average price data refer to January 2026 and are compared to January 2025 unless otherwise noted. All comparisons are provided on a “per calendar day” basis to remove from consideration variability in the number of days per month or three-month period.)
SALES
Same-store sales increased 5.8% year-over-year. In the previous month (December 2025), same-store sales increased 4.5% year-over-year.
Same-store sales decreased 6.6% compared to the previous month (December 2025). Same-store sales in December 2025 increased 1.2% compared to the previous month (November 2025).
For the three months ended January 31, 2026, same-store sales increased 4.3% compared to the corresponding three months a year ago.
UNITS SOLD
Units sold increased 2.9% year-over-year. In the previous month (December 2025), units sold increased 1.7% year-over-year.
Units sold decreased 2.2% compared to the previous month (December 2025). Units sold in December 2025 decreased 0.4% compared to the previous month (November 2025).
BASKETS (TRANSACTIONS) PER STORE
Baskets increased 0.3% year-over-year. In the previous month (December 2025), baskets decreased 0.5% year-over-year.
Baskets decreased 4.6% compared to the previous month (December 2025). Baskets in December 2025 decreased 3.0% compared to the previous month (November 2025).
AVERAGE PRICES
A dollar-weighted average of prices for the top 500 items purchased in January 2026 increased 1.2% year-over-year, less than the 2.3% year-over-year increase in December 2025.
Commentary from Brandon Thurber (VP, Data Sales & Client Success at NRS)
“January same-store results again showed solid year-over-year growth in both dollar sales and transactions. The three-month rolling average of same-store sales has increased by over 4% for eight consecutive months. Sequentially, sales decreased in-line with expected seasonal patterns after the holidays.
“Dry January had a more muted impact this year than we anticipated. Sales across Spirits remained resilient, with Ready-to Drink (RTD) Spirits performing particularly well. Also in January, Nicotine Alternatives sustained their upward momentum. Counterintuitively, Frozen Novelties – ready-to-eat frozen treats – increased double digits year-over-year despite frigid weather across many regions.
“Raleigh-Durham stood out as a top-performing DMA, posting strong gains in both dollars and transactions, while New York was among the weakest. Significant regional disparities reinforce the value of localized and store-level data in understanding drivers of category performance. The ability to track real product movement and category performance at the local level is becoming increasingly valuable for suppliers and distributors looking to make smarter, faster decisions.
“Our measure of inflation – the average rate of year-over-year price increase for the best-selling items on our network – continued to moderate, dropping to 1.2% in January from 2.3% in December 2025 and 3.1% in November 2025.”
NRSInsights Reports
The NRSInsights monthly Retail Same-Store Sales Reports are intended to provide timely topline data reflective of sales at NRS’ network of independent, predominantly urban, retail stores.
Same-store data comparisons of January 2026 with January 2025 are derived from approximately 207 million transactions processed through the approximately 24,700 stores on the NRS network that scanned transactions in both months. Same-store data comparisons of January 2026 with December 2025 are derived from approximately 260 million transactions processed through approximately 32,500 stores.
Same-store data comparisons for the three months ended January 31, 2026 with the year-ago three months are derived from approximately 624 million transactions processed through those stores that scanned transactions in both three-month periods.
NRS POS Platform
The NRS platform predominantly serves small-format, independent, retail stores nationwide including convenience stores, bodegas, liquor stores, grocers, and tobacco and sundries sellers. These independent retailers operate in all 50 states and the District of Colombia, including 205 of the 210 designated market areas (DMAs) in the United States, and in Canada. During January 2026, NRS’ POS terminals processed $2.0 billion in sales (+16% year-over-year) across 130 million transactions.
About National Retail Solutions (NRS):
National Retail Solutions operates a leading point-of-sale (POS) terminal-based platform and digital payment processing service for independent retailers nationwide. Retailers utilize NRS offerings to process transactions and effectively manage their businesses. Consumer packaged goods (CPG) suppliers, brokers, analytics firms, and advertisers access the terminal’s digital display network to reach these retailers’ predominantly urban, multi-cultural shopper base, and to harness transaction data-based learnings to identify growth opportunities and measure execution and returns on marketing investment. NRS is a subsidiary of IDT Corporation (NYSE: IDT).
All statements above that are not purely about historical facts, including, but not limited to, those in which we use the words “believe,” “anticipate,” “expect,” “plan,” “intend,” “estimate,” “target” and similar expressions, are forward-looking statements within the meaning of the Private Securities Litigation Reform Act of 1995. While these forward-looking statements represent our current judgment of what may happen in the future, actual results may differ materially from the results expressed or implied by these statements due to numerous important factors. Our filings with the SEC provide detailed information on such statements and risks, and should be consulted along with this release. To the extent permitted under applicable law, IDT assumes no obligation to update any forward-looking statements.
NRSInsights Contact:
Brandon Thurber VP, Data Sales & Client Success at NRS National Retail Solutions Brandon.Thurber@nrsplus.com
NRSInsights’ December 2025 Retail Same-Store Sales Report
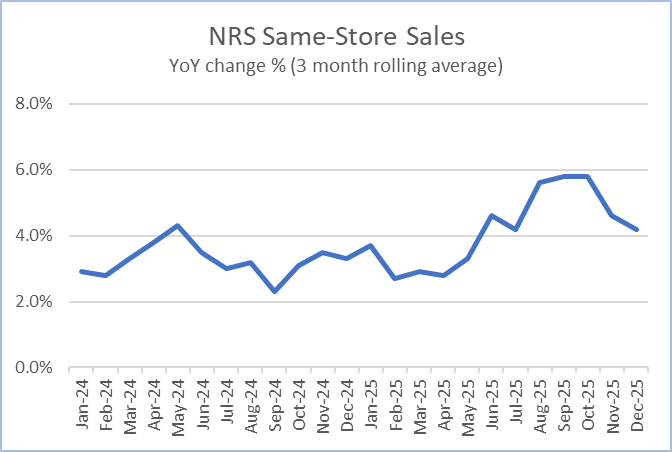
December same-store sales increased 4.5% year-over-year
The average price paid for the top 500 items in December increased 2.3% year-over-year
NEWARK, N.J., Jan. 09, 2026 (GLOBE NEWSWIRE) — NRSInsights, a provider of sales data and analytics drawn from retail transactions processed through the National Retail Solutions (NRS) point-of-sale (POS) platform, today announced comparative retail same-store sales results for December 2025.
As of December 31, 2025, the NRS retail network comprised approximately 38,700 active terminals nationwide, scanning purchases at approximately 33,200 independent retailers, including convenience stores, bodegas, liquor stores, grocers, and tobacco and sundries sellers, predominantly serving urban consumers.
December Highlights
(Same-store sales, unit sales, transactions, and average price data refer to December 2025 and are compared to December 2024 unless otherwise noted. All comparisons are provided on a “per calendar day” basis to remove from consideration variability in the number of days per month or three-month period.)
SALES
Same-store sales increased 4.5% year-over-year. In the previous month (November 2025), same-store sales increased 3.8% year-over-year.
Same-store sales increased 1.2% compared to the previous month (November 2025). Same-store sales in November 2025 decreased 0.7% compared to the previous month (October 2025).
For the three months ended December 31, 2025, same-store sales increased 4.2% compared to the corresponding three months a year ago.
UNITS SOLD
Units sold increased 1.7% year-over-year. In the previous month (November 2025), units sold increased 0.9% year-over-year.
Units sold decreased 0.4% compared to the previous month (November 2025). Units sold in November 2025 decreased 0.9% compared to the previous month (October 2025).
BASKETS (TRANSACTIONS) PER STORE
Baskets decreased 0.5% year-over-year. In the previous month (November 2025), baskets decreased 0.9% year-over-year.
Baskets decreased 3.0% compared to the previous month (November 2025). Baskets in November 2025 decreased 3.7% compared to the previous month (October 2025).
AVERAGE PRICES
A dollar-weighted average of prices for the top 500 items purchased in December increased 2.3% year-over-year, a slight increase from the 3.1% year-over-year increase in November 2025.
Retail Trade Comparative Data
As a result of the recent government shutdown, U.S. Commerce Department’s Advance Monthly Retail Trade comparative same-store sales data excluding food service has not been released.
Commentary from Brandon Thurber (VP, Data Sales & Client Success at NRS)
“December capped off the year with solid same-store dollar growth. Sales increased 4.5% year over year, supported by a 1.7% rise in units sold, while inflationary pressure eased.
“Larger basket sizes and strong category performance helped drive the sales increase overcoming a slight dip in transactions.
“Cigarettes, prepared cocktails, smokeless tobacco, energy drinks, and rolling papers led the month’s increase, reflecting continued demand for convenience and adult-use categories.”
NRSInsights Reports
The NRSInsights monthly Retail Same-Store Sales Reports are intended to provide timely topline data reflective of sales at NRS’ network of independent, predominantly urban, retail stores.
Same-store data comparisons of December 2025 with December 2024 are derived from approximately 217 million transactions processed through the approximately 24,300 stores on the NRS network that scanned transactions in both months. Same-store data comparisons of December 2025 with November 2025 are derived from approximately 266 million transactions processed through approximately 32,200 stores.
Same-store data comparisons for the three months ended December 31, 2025 with the year-ago three months are derived from approximately 644 million transactions processed through those stores that scanned transactions in both three-month periods.
NRS POS Platform
The NRS platform predominantly serves small-format, independent, retail stores nationwide including convenience stores, bodegas, liquor stores, grocers, and tobacco and sundries sellers. These independent retailers operate in all 50 states and the District of Colombia, including 205 of the 210 designated market areas (DMAs) in the United States, and in Canada. During December 2025, NRS’ POS terminals processed $2.2 billion in sales (+15% year-over-year) across 136 million transactions.
About National Retail Solutions (NRS):
National Retail Solutions operates a leading point-of-sale (POS) terminal-based platform and digital payment processing service for independent retailers nationwide. Retailers utilize NRS offerings to process transactions and effectively manage their businesses. Consumer packaged goods (CPG) suppliers, brokers, analytics firms, and advertisers access the terminal’s digital display network to reach these retailers’ predominantly urban, multi-cultural shopper base, and to harness transaction data-based learnings to identify growth opportunities and measure execution and returns on marketing investment. NRS is a subsidiary of IDT Corporation (NYSE: IDT).
All statements above that are not purely about historical facts, including, but not limited to, those in which we use the words “believe,” “anticipate,” “expect,” “plan,” “intend,” “estimate,” “target” and similar expressions, are forward-looking statements within the meaning of the Private Securities Litigation Reform Act of 1995. While these forward-looking statements represent our current judgment of what may happen in the future, actual results may differ materially from the results expressed or implied by these statements due to numerous important factors. Our filings with the SEC provide detailed information on such statements and risks, and should be consulted along with this release. To the extent permitted under applicable law, IDT assumes no obligation to update any forward-looking statements.
NRSInsights Contact: Brandon Thurber VP, Data Sales & Client Success at NRS National Retail Solutions Brandon.Thurber@nrsplus.com
NRSInsights’ November 2025 Retail Same-Store Sales Report
November same-store sales increased 3.8% year-over-year
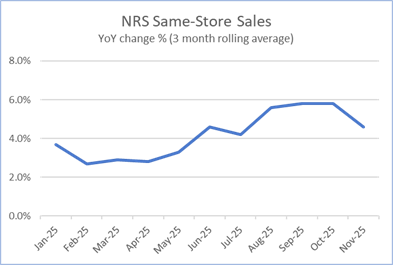
The average price paid for the top 500 items in November increased 3.1% year-over-year
NEWARK, N.J., Dec. 09, 2025 (GLOBE NEWSWIRE) — NRSInsights, a provider of sales data and analytics drawn from retail transactions processed through the National Retail Solutions (NRS) point-of-sale (POS) platform, today announced comparative retail same-store sales results for November 2025.
As of November 30, 2025, the NRS retail network comprised approximately 38,000 active terminals nationwide, scanning purchases at approximately 32,900 independent retailers, including convenience stores, bodegas, liquor stores, grocers, and tobacco and sundries sellers, predominantly serving urban consumers.
November Highlights
(Same-store sales, unit sales, transactions, and average price data refer to November 2025 and are compared to November 2024 unless otherwise noted. All comparisons are provided on a “per calendar day” basis to remove from consideration variability in the number of days per month or three-month period.)
SALES
Same-store sales increased 3.8% year-over-year. In the previous month (October 2025), same-store sales increased 5.7% year-over-year.
Same-store sales decreased 0.7% compared to the previous month (October 2025). Same-store sales in October 2025 also decreased 0.7% compared to the previous month (September 2025).
For the three months ended November 30, 2025, same-store sales increased 4.6% compared to the corresponding three months a year ago.
UNITS SOLD
Units sold increased 0.9% year-over-year. In the previous month (October 2025), units sold increased 1.3% year-over-year.
Units sold decreased 0.9% compared to the previous month (October 2025). Units sold in October 2025 decreased 1.8% compared to the previous month (September 2025).
BASKETS (TRANSACTIONS) PER STORE
Baskets decreased 0.9% year-over-year. In the previous month (October 2025), baskets increased 0.1% year-over-year.
Baskets decreased 3.7% compared to the previous month (October 2025). Baskets in October 2025 decreased 2.6% compared to the previous month (September 2025).
AVERAGE PRICES
A dollar-weighted average of prices for the top 500 items purchased in November increased 3.1% year-over-year, a slight increase from the 3.0% year-over-year increase in October 2025.
Retail Trade Comparative Data
As a result of the recent government shutdown, U.S. Commerce Department’s Advance Monthly Retail Trade same-store sales data excluding food service for October has not been released.
Commentary from Brandon Thurber (VP, Data Sales & Client Success at NRS)
“NRS’ independent retailer network generated steady momentum in November, with transactions up 0.9% and dollar sales increasing 3.8% versus November a year ago.
“Growth was driven by continued strong performance in key convenience categories, including cigarettes, RTD cocktails, smokeless tobacco, and energy beverages.
“Our measure of inflation in November reached 3.1%, its highest level this year and a slight increase from the 3.0% recorded in October.
“These results highlight the resilience of everyday convenience spending and the value our retailers provide to their local communities.”
NRSInsights Reports
The NRSInsights monthly Same-Store Retail Sales Reports are intended to provide timely topline data reflective of sales at NRS’ network of independent, predominantly urban, retail stores.
Same-store data comparisons of November 2025 with November 2024 are derived from approximately 216 million transactions processed through the approximately 24,000 stores on the NRS network that scanned transactions in both months. Same-store data comparisons of November 2025 with October 2025 are derived from approximately 272 million transactions processed through approximately 32,000 stores.
Same-store data comparisons for the three months ended November 30, 2025 with the year-ago three months are derived from approximately 651 million transactions processed through those stores that scanned transactions in both three-month periods.
NRS POS Platform
The NRS platform predominantly serves small-format, independent, retail stores nationwide including convenience stores, bodegas, liquor stores, grocers, and tobacco and sundries sellers. These independent retailers operate in all 50 states and the District of Colombia, including 205 of the 210 designated market areas (DMAs) in the United States, and in Canada. During November 2025, NRS’ POS terminals processed $2.07 billion in sales (+14% year-over-year) across 135 million transactions.
About National Retail Solutions (NRS):
National Retail Solutions operates a leading point-of-sale (POS) terminal-based platform and digital payment processing service for independent retailers nationwide. Retailers utilize NRS offerings to process transactions and effectively manage their businesses. Consumer packaged goods (CPG) suppliers, brokers, analytics firms, and advertisers access the terminal’s digital display network to reach these retailers’ predominantly urban, multi-cultural shopper base, and to harness transaction data-based learnings to identify growth opportunities and measure execution and returns on marketing investment. NRS is a subsidiary of IDT Corporation (NYSE: IDT).
All statements above that are not purely about historical facts, including, but not limited to, those in which we use the words “believe,” “anticipate,” “expect,” “plan,” “intend,” “estimate,” “target” and similar expressions, are forward-looking statements within the meaning of the Private Securities Litigation Reform Act of 1995. While these forward-looking statements represent our current judgment of what may happen in the future, actual results may differ materially from the results expressed or implied by these statements due to numerous important factors. Our filings with the SEC provide detailed information on such statements and risks, and should be consulted along with this release. To the extent permitted under applicable law, IDT assumes no obligation to update any forward-looking statements.
NRSInsights Contact: Brandon Thurber VP, Data Sales & Client Success at NRS National Retail Solutions Brandon.Thurber@nrsplus.com
IDT Corporation Reports First Quarter Fiscal Year 2026 Results
Income from operations at NRS, Fintech and net2phone segments increase by 35%, 97% and 94%, respectively Record quarterly levels of consolidated gross profit, Adjusted EBITDA* and Adjusted EBITDA margin*
NEWARK, NJ, Dec. 04, 2025 (GLOBE NEWSWIRE) — IDT Corporation (NYSE: IDT), a global provider of fintech and communications solutions, today reported results for the first quarter of its fiscal year 2026, the three months ended October 31, 2025.
1Q26 HIGHLIGHTS
Throughout this release, unless otherwise noted, results for the first quarter of fiscal year 2026 (1Q26) are compared to the first quarter of fiscal year 2025 (1Q25).
Segments
NRS
Recurring revenue: +22% to $35.3 million;
Income from operations: +35% to $8.9 million;
Adjusted EBITDA*: +33% to $10.3 million;
‘Rule of 40’* score: 50;
Fintech
BOSS Money digital revenue: +20% to $27.9 million;
Fintech total revenue: +15% to $42.7 million;
Income from operations: +97% to $6.4 million;
Adjusted EBITDA: +87% to $7.5 million;
net2phone
Subscription revenue: +10% to $23.0 million;
Income from operations: +94% to $1.9 million;
Adjusted EBITDA: +44% to $3.6 million;
Traditional Communications
Revenue: (0.5)% to $219.5 million;
Income from operations: +1% to $15.8 million;
Adjusted EBITDA: +2% to $18.9 million;
IDT Consolidated
Revenue: +4% to $322.8 million;
Gross profit / margin: +10% to $118.2 million / +180 bps to 36.6%;
Income from operations: +31% to $30.9 million;
Net income attributable to IDT: +30% to $22.3 million;
GAAP EPS: Increased to $0.89 from $0.68;
Non-GAAP EPS*: Increased to $0.94 from $0.71;
Adjusted EBITDA: +26% to $37.9 million;
CapEx: +10% to $5.8 million;
Repurchases of IDT Common Stock: 158 thousand shares for $7.6 million
*This release discloses certain Non-GAAP financial measures [Adjusted EBITDA, Adjusted EBITDA margin, Non-GAAP EPS, NRS ‘Rule of 40,’ and adjusted net cash provided by operating activities] as well as certain Key Performance Metrics [net2phone subscription revenue, NRS monthly average recurring revenue per terminal, and BOSS Money digital and retail transactions, average BOSS Money revenue per transaction, and BOSS Money digital channel send volume.] Please see the explanations of those measures and metrics, the reasons for their inclusion and reconciliations of non-GAAP measures to their closest GAAP measures at the end of this release.
REMARKS BY SHMUEL JONAS, CEO
IDT delivered consolidated revenue growth and record levels of gross profit and Adjusted EBITDA in the first quarter. NRS led the top-line expansion, while all three of our growth segments reported strong bottom-line results. Our Traditional Communications segment again provided steady cash generation.
NRS recurring revenue increased 22% year-over-year, helping to drive a 35% increase in income from operations and a 33% increase in Adjusted EBITDA. This quarter we continued to launch and build-out innovative premium services – delivery integrations, couponing, and product data scan programs to name a few. Our premium offerings are becoming important growth drivers, and factored into the large increase in average recurring revenue per terminal* this quarter. There is tremendous opportunity for additional, long-term growth through innovation both in NRS’s current and in adjacent markets.
At BOSS Money, our digital channel continues to outperform retail, and that trend may accelerate as implementation of the new federal excise tax on cash remittances begins on January 1st. The Fintech segment’s income from operations and Adjusted EBITDA nearly doubled year-over-year, aided by BOSS Money’s increasing operating leverage and the enhanced profitability of other, smaller Fintech initiatives. Our push to integrate tailored AI and machine learning into BOSS Money customer service and fraud detection activities have helped to significantly improve unit economics. Looking ahead, we will soon introduce the first generation of the BOSS Wallet, enabling our U.S. customers to share cash and receive rewards.
During the quarter, net2phone began offering its AI agent to both our existing and new customers, and added our Coach AI solution at the quarter’s end. Increasingly, our customers are ordering multiple net2phone offerings to enhance their operations and streamline workflows. As a result, we have pivoted from stand-alone product offerings to holistic solutions comprised of multiple offerings tailored to customers’ communications and workflows. This approach plays to net2phone’s product and distribution strengths, and we are very excited about the potential as we continue to add AI solutions.
On a final note, the Delaware Supreme Court in a ruling issued yesterday affirmed the decision of the Court of Chancery dismissing all claims against IDT in the Straight Path class action suit, and we are very pleased that this case has now been favorably resolved.
1Q26 RESULTS BY SEGMENT
National Retail Solutions (NRS)
(in millions except for active POS terminals, payment processing accounts, recurring revenue per terminal, and gross profit margin)
1Q26
4Q25
1Q25
1Q26-1Q25 (% Δ)
Terminals and payment processing accounts
Active POS terminals
37,900
37,200
33,100
4,800
Payment processing accounts
27,300
26,500
22,700
4,600
Recurring revenue
Merchant Services & Other
$
23.8
$
21.8
$
17.2
+38
%
Advertising and Data
$
7.3
$
6.8
$
8.5
(15
)%
SaaS Fees
$
4.2
$
4.1
$
3.3
+30
%
Total recurring revenue
$
35.3
$
32.6
$
28.9
+22
%
POS Terminal Sales
$
1.8
$
1.7
$
1.4
+26
%
Total revenue
$
37.1
$
34.3
$
30.4
+22
%
Monthly average recurring revenue per terminal*
$
313
$
299
$
295
+6
%
Gross profit
$
33.5
$
30.5
$
27.6
+21
%
Gross profit margin
90.2
%
88.9
%
91.0
%
(80) bps
Technology & development
$
2.7
$
2.3
$
2.0
+33
%
SG&A
$
21.9
$
20.0
$
19.0
+15
%
Income from operations
$
8.9
$
5.8
$
6.6
+35
%
Adjusted EBITDA
$
10.3
$
9.5
$
7.7
+33
%
CapEx
$
1.6
$
1.3
$
1.2
+32
%
NRS Take-Aways
•
NRS added approximately 800 net active terminals and net payment processing accounts during 1Q26. The net additions in 1Q26 reflected the expected seasonal churn of retailers that were active in the summer as well as other non-seasonal drivers. NRS has begun to implement initiatives to address non-seasonal churn and boost new sales.
•
NRS continues to expand retail delivery options for participating merchants. Earlier in CY 2025, NRS partnered with DoorDash and began the process of activating priority NRS retailers. Participating NRS stores with the DoorDash direct integration are seeing meaningful increases in revenues and order volumes. During 1Q26, NRS also launched a direct integration service with Grubhub and the process of store activation with participating NRS retailers is now underway.
•
The year-over-year increases in Merchant Services (+38%) and SaaS Fees (+30%) revenue more than offset a decline in Advertising & Data revenue (-15%) to drive average recurring revenue per terminal to $313 from $295. Merchant Services primary growth drivers include the increase in active payment processing accounts, increased customers’ utilization of credit and debit cards versus cash, and increased same-store sales. SaaS Fees growth drivers include the increase in active terminals and increasing retailer adoption of premium terminal software plans and services.
•
The year-over-year decrease in Advertising & Data revenue reflects, in part, the industry-wide decline in CPMs resulting from the expansion of inventories as leading streaming services have launched ad-supported tiers. The sequential revenue increase was driven by NRS’s direct channel sales.
BOSS Money and Fintech Segment
(in millions except for average revenue per transaction and gross profit margin)
1Q26
4Q25
1Q25
1Q26-1Q25 (% Δ, $)
BOSS Money Transactions*
6.6
6.6
5.6
+18
%
Digital channel
5.5
5.5
4.5
+22
%
Retail channel
1.1
1.1
1.1
0
%
Fintech Segment Revenue
BOSS Money
$
38.3
$
38.2
$
33.7
+14
%
Digital channel
$
27.9
$
27.6
$
23.3
+20
%
Retail channel
$
10.4
$
10.6
$
10.4
+0
%
Other
$
4.4
$
3.9
$
3.4
+31
%
Total Fintech Segment Revenue
$
42.7
$
42.1
$
37.1
+15
%
Average BOSS Money revenue per transaction*
$
5.79
$
5.81
$
6.01
(4
)%
Fintech Segment
Gross profit
$
25.5
$
24.9
$
21.6
+18
%
Gross profit margin
59.8
%
59.1
%
58.2
%
160 bps
Technology & development
$
2.5
$
2.3
$
2.3
+9
%
SG&A
$
16.7
$
17.8
$
16.1
+4
%
Income from operations
$
6.4
$
4.8
$
3.2
+97
%
Adjusted EBITDA
$
7.5
$
5.5
$
4.0
+87
%
CapEx
$
0.8
$
0.8
$
1.1
(23
)%
BOSS Money and Fintech Take-Aways:
•
Digital channel send volume*, namely, the amount of principal transferred by BOSS Money customers using the BOSS Money and BOSS Revolution apps, increased by 34% in 1Q26 compared to 1Q25 reflecting both the increased transaction volume and increased average dollars sent per transaction.
•
The Fintech segment’s robust income from operations and Adjusted EBITDA growth was driven by BOSS Money transaction growth and decreases in unit digital sales chargebacks, payout commission, and other operating costs.
net2phone
(Seats in thousands. All others except gross profit margin in millions)
1Q26
4Q25
1Q25
1Q26-1Q25 (% Δ, $)
Seats
432
422
406
+7
%
Revenue
Subscription revenue*
$
23.0
$
22.2
$
21.0
+10
%
Other revenue
$
0.4
$
0.5
$
0.6
(34
)%
Total Revenue
$
23.5
$
22.8
$
21.6
+9
%
Gross profit
$
18.7
$
18.1
$
17.1
+10
%
Gross profit margin
79.9
%
79.5
%
79.0
%
+90 bps
Technology & development
$
3.0
$
3.0
$
3.0
+3
%
SG&A
$
13.7
$
13.3
$
13.1
+5
%
Income from operations
$
1.9
$
1.5
$
1.0
+94
%
Adjusted EBITDA
$
3.6
$
3.5
$
2.5
+44
%
CapEx
$
1.8
$
1.7
$
1.6
+10
%
net2phone Take-Aways:
•
Subscription revenue increased by 10% year over year, reflecting the increase in seats served augmented by an increase in higher average revenue CCaaS seats.
•
In 1Q26, net2phone realized the first sales of its AI agent, and, at quarter’s end, launched its AI coaching agent, Coach.
•
net2phone generated substantial year-over-year increases in income from operations and Adjusted EBITDA in 1Q26. Despite accelerating its strategic investments in AI product development, net2phone was able to increase profitability as it continued to benefit from increased operating leverage as its business scales.
Traditional Communications
(in millions except gross profit margin)
1Q26
4Q25
1Q25
1Q26-1Q25 (% Δ)
Revenue
IDT Digital Payments
$
107.1
$
107.0
$
105.1
+2%
BOSS Revolution
$
47.0
$
49.3
$
56.8
(17
)%
IDT Global
$
59.6
$
55.9
$
52.4
+14%
Other
$
5.8
$
5.3
$
6.2
(5
)%
Total Revenue
$
219.5
$
217.4
$
220.5
(0.5
)%
Gross profit
$
40.4
$
41.0
$
41.3
(2
)%
Gross profit margin
18.4
%
18.8
%
18.8
%
(40) bps
Technology & development
$
5.5
$
5.3
$
5.5
(1
)%
SG&A
$
19.0
$
19.9
$
20.0
(5
)%
Income from operations
$
15.8
$
15.4
$
15.7
+1%
Adjusted EBITDA
$
18.9
$
17.8
$
18.4
+2%
CapEx
$
1.5
$
1.4
$
1.4
+13%
Traditional Communications Take-Aways:
•
IDT Digital Payments’ gross profit contribution continued to increase as customers migrate their purchasing experience from retail to higher margin digital channels. The Zendit B2B platform increased revenue by over 90% year-over-year with growth across its mobile top-up, prepaid gift card and e-sim verticals.
•
IDT’s ongoing efforts to reduce operational costs resulted in a 5% decrease in the segment’s SG&A expense, enabling the increases in segment-level income from operations and Adjusted EBITDA.
OTHER FINANCIAL RESULTS
Consolidated results for all periods presented include corporate overhead. Corporate G&A expense decreased 6% to $2.7 million in 1Q26 from $2.9 million in 1Q25.
As of October 31, 2025, IDT held $220.0 million in cash, cash equivalents, debt securities, and current equity investments, exclusive of restricted cash. Also as of October 31, 2025, current assets totaled $550.5 million and current liabilities totaled $305.4 million. IDT had no outstanding debt at the quarter end.
Net cash used in operating activities in 1Q26 was $10.1 million compared to net cash provided by operating activities of $164 thousand in 1Q25. Exclusive of changes in customer funds deposits at IDT’s Fintech segment, adjusted net cash used in operating activities* in 1Q26 was $20.7 million compared to $2.6 million used in 1Q25. The decline in cash is due entirely to working capital timing, as 1Q26 ended on a Friday, which is almost always the day of the week where cash levels are at their lowest, due to prepaid weekend funding requirements for IDT’s BOSS Money remittance business.
Capital expenditures increased to $5.8 million in 1Q26 from $5.3 million in 1Q25.
FY 2026 FINANCIAL OUTLOOK
As mentioned in last quarter’s (4Q25) earnings release, starting with 1Q26 IDT has revised its non-GAAP Adjusted EBITDA definition to exclude non-cash compensation expense. Prior period results have been adjusted to the new definition. The FY 2026 Reclassification table at the end of this release provides a reconciliation to the former Adjusted EBITDA measure.
IDT maintains its previous FY 2026 guidance (which had been given using the revised Adjusted EBITDA definitions) – expecting to generate Adjusted EBITDA within the range of $141-$145 million.
Reconciliations of Adjusted EBITDA to net income and income from operations for all periods presented are included in the Non-GAAP reconciliations provided at the end of this release.
DIVIDEND
The Board of Directors of IDT Corporation declared a quarterly cash dividend of $0.06 per share of IDT Common stock payable on December 23, 2025 to stockholders of record as of December 15, 2025.
IDT EARNINGS ANNOUNCEMENT INFORMATION
This release is available for download in the “Investors & Media” section of the IDT Corporation website (https://www.idt.net/investors-and-media) and has been filed on a current report (Form 8-K) with the SEC.
IDT will host an earnings conference call beginning at 5:30 PM Eastern today with management’s discussion of results followed by Q&A with investors. To listen to the call and participate in the Q&A, dial 1-888-506-0062 (toll-free from the U.S.) or 1-973-528-0011 (international) and provide the following access code: 586702.
A replay of the conference call will be available approximately three hours after the call concludes through December 18, 2025. To access the call replay, dial 1-877-481-4010 (toll-free from the U.S.) or 1-919-882-2331 (international) and provide this replay passcode: 53127. The replay will also be accessible via streaming audio at the IDT investor relations website.
ABOUT IDT CORPORATION
IDT Corporation (NYSE: IDT) is a global provider of fintech and communications solutions through a portfolio of synergistic businesses: National Retail Solutions (NRS), through its point-of-sale (POS) platform, enables independent retailers to operate more effectively while providing advertisers and marketers with unprecedented reach into underserved consumer markets; BOSS Money facilitates innovative international remittances and fintech payments solutions; net2phone provides enterprises and organizations with intelligently integrated cloud communications and contact center services across channels and devices; IDT Digital Payments and the BOSS Revolution calling service make sharing prepaid products and services and speaking with friends and family around the world convenient and reliable; and, IDT Global and IDT Express enable communications services to provision and manage international voice and SMS messaging.
All statements above that are not purely about historical facts, including, but not limited to, those in which we use the words “believe,” “anticipate,” “expect,” “plan,” “intend,” “estimate,” “target” and similar expressions, are forward-looking statements within the meaning of the Private Securities Litigation Reform Act of 1995. While these forward-looking statements represent our current judgment of what may happen in the future, actual results may differ materially from the results expressed or implied by these statements due to numerous important factors. Our filings with the SEC provide detailed information on such statements and risks and should be consulted along with this release. To the extent permitted under applicable law, IDT assumes no obligation to update any forward-looking statements.
Trade accounts receivable, net of allowance for credit losses of $9,321 at October 31, 2025 and $9,097 at July 31, 2025
42,562
42,867
Settlement assets, net of reserve of $1,532 at October 31, 2025 and $1,367 at July 31, 2025
46,475
28,014
Disbursement prefunding
75,953
37,097
Prepaid expenses
12,439
14,505
Other current assets
29,203
28,702
Total current assets
550,528
520,303
Property, plant, and equipment, net
39,765
38,869
Goodwill
26,548
26,488
Other intangibles, net
4,739
5,056
Equity investments
4,650
6,658
Operating lease right-of-use assets
1,644
1,878
Deferred income tax assets, net
18,779
18,790
Other assets
8,259
8,161
Total assets
$
654,912
$
626,203
Liabilities, redeemable noncontrolling interest, and equity
Current liabilities:
Trade accounts payable
$
14,582
$
19,435
Accrued expenses
91,871
97,295
Deferred revenue
28,627
27,726
Customer funds deposits
124,932
114,708
Settlement liabilities
15,105
13,922
Other current liabilities
30,305
19,910
Total current liabilities
305,422
$
292,996
Operating lease liabilities
904
1,103
Other liabilities
926
1,688
Total liabilities
307,252
295,787
Commitments and contingencies
Redeemable noncontrolling interest
11,643
11,459
Equity:
IDT Corporation stockholders’ equity:
Preferred stock, $.01 par value; authorized shares-10,000; no shares issued
–
–
Class A common stock, $.01 par value; authorized shares-35,000; 3,272 shares issued and 1,574 shares outstanding at October 31, 2025 and July 31, 2025
33
33
Class B common stock, $.01 par value; authorized shares-200,000; 28,529 and 28,528 shares issued and 23,499 and 23,656 shares outstanding at October 31, 2025 and July 31, 2025, respectively
285
285
Additional paid-in capital
310,126
308,111
Treasury stock, at cost, consisting of 1,698 and 1,698 shares of Class A common stock and 5,030 and 4,872 shares of Class B common stock at October 31, 2025 and July 31, 2025, respectively
(151,457
)
(143,853
)
Accumulated other comprehensive loss
(16,268
)
(16,569
)
Retained earnings
177,972
157,124
Total IDT Corporation stockholders’ equity
320,691
305,131
Noncontrolling interests
15,326
13,826
Total equity
336,017
318,957
Total liabilities, redeemable noncontrolling interest, and equity
$
654,912
$
626,203
IDT CORPORATION CONDENSED CONSOLIDATED STATEMENTS OF INCOME (Unaudited)
Three Months Ended October 31,
2025
2024
(in thousands, except per share data)
Revenues
$
322,752
$
309,566
Direct cost of revenues
204,573
201,939
Gross profit
118,179
107,627
Operating expenses (income):
Selling, general and administrative
74,007
71,051
Technology and development
13,631
12,759
Severance
204
177
Other operating income, net
(589
)
–
Total operating expenses
87,253
83,987
Income from operations
30,926
23,640
Interest income, net
1,708
1,428
Other expense, net
(467
)
(283
)
Income before income taxes
32,167
24,785
Provision for income taxes
(8,071
)
(6,302
)
Net income
24,096
18,483
Net income attributable to noncontrolling interests
(1,734
)
(1,234
)
Net income attributable to IDT Corporation
$
22,362
$
17,249
Earnings per share attributable to IDT Corporation common stockholders:
Basic
$
0.89
$
0.68
Diluted
$
0.89
$
0.68
Weighted-average number of shares used in calculation of earnings per share:
Basic
25,183
25,204
Diluted
25,193
25,363
Stock-based compensation included in total operating expenses:
$
2,015
$
912
IDT CORPORATION CONDENSED CONSOLIDATED STATEMENTS OF CASH FLOWS (Unaudited)
Three Months Ended October 31,
2025
2024
(in thousands)
Operating activities
Net income
$
24,096
$
18,483
Adjustments to reconcile net income to net cash (used in) provided by operating activities:
Depreciation and amortization
5,305
5,241
Deferred income taxes
11
5,485
Provision for credit losses and reserve for settlement assets
929
1,002
Stock-based compensation
2,015
912
Other
1,449
692
Changes in assets and liabilities:
Trade accounts receivable
1,270
689
Settlement assets, disbursement prefunding, prepaid expenses, other current assets, and other assets
(56,417
)
(21,269
)
Trade accounts payable, accrued expenses, settlement liabilities, other current liabilities, and other liabilities
(350
)
(12,771
)
Customer funds deposits
10,608
2,810
Deferred revenue
944
(1,110
)
Net cash (used in) provided by operating activities
(10,140
)
164
Investing activities
Capital expenditures
(5,821
)
(5,278
)
Purchase of convertible preferred stock in equity method investment
–
(673
)
Purchases of debt securities and equity investments
(16,061
)
(12,669
)
Proceeds from maturities and sales of debt securities and redemption of equity investments
12,684
9,878
Net cash used in investing activities
(9,198
)
(8,742
)
Financing activities
Dividends paid
(1,514
)
(1,261
)
Distributions to noncontrolling interests
(50
)
–
Proceeds from borrowings under revolving credit facility
12,713
14,243
Repayment of borrowings under revolving credit facility
(12,713
)
(14,243
)
Repurchases of Class B common stock
(7,604
)
(2,432
)
Net cash used in financing activities
(9,168
)
(3,693
)
Effect of exchange rate changes on cash, cash equivalents, and restricted cash and cash equivalents
(160
)
28
Net decrease in cash, cash equivalents, and restricted cash and cash equivalents
(28,666
)
(12,243
)
Cash, cash equivalents, and restricted cash and cash equivalents at beginning of period
341,832
255,456
Cash, cash equivalents, and restricted cash and cash equivalents at end of period
$
313,166
$
243,213
Supplemental Schedule of Non-Cash Financing Activities
Shares of the Company’s Class B common stock issued to an executive officer for bonus payment
$
–
$
1,824
FY 2026 Reclassification
Effective fiscal 1Q26, the Company revised its non-GAAP Adjusted EBITDA definition to exclude non-cash compensation expense. Prior period results were adjusted to the new definition.
The revision is intended to make IDT’s measure of Adjusted EBITDA more directly comparable to those reported by IDT’s peers while more closely reflecting consolidated and segment level operating cash flows.
The table below reconciles the revised measure of IDT’s non-GAAP Adjusted EBITDA to the measure previously provided for each quarter and full year FY 2024, FY 2025, and for 1Q26 and the trailing twelve months (TTM) ended October 1, 2025:
1Q24
2Q24
3Q24
4Q24
FY 2024
1Q25
2Q25
3Q25
4Q25
FY 2025
1Q26
TTM
Current Measure
National Retail Solutions (NRS)
6.4
6.3
5.8
7.7
26.2
7.7
10.3
7.8
9.5
35.4
10.3
37.9
Fintech
-0.6
0.1
0.3
1.5
1.3
4.0
3.9
5.1
5.5
18.6
7.5
22.0
net2phone
1.5
1.8
2.1
2.5
7.9
2.5
2.9
3.2
3.5
12.1
3.6
13.2
Traditional Communications
18.5
18.9
16.7
17.6
71.7
18.4
20.6
19.6
17.8
76.4
18.9
76.8
Corporate
-2.7
-2.9
-2.2
-2.1
-9.9
-2.8
-2.8
-2.6
-2.5
-10.7
-2.4
-10.3
IDT Consolidated
23.0
24.2
22.7
27.2
97.1
30.0
34.9
33.1
33.8
131.7
37.9
139.6
Non-Cash Compensation
National Retail Solutions (NRS)
0.2
0.2
0.2
0.6
1.2
0.2
0.2
0.6
0.2
1.1
0.2
1.2
Fintech
0.1
0.1
0.1
0.0
0.3
0.0
0.1
0.1
0.0
0.2
0.3
0.5
net2phone
0.0
0.0
0.0
0.0
0.0
0.0
0.0
0.0
0.0
0.0
0.0
0.0
Traditional Communications
0.4
2.0
1.8
1.3
5.4
0.6
0.3
0.3
0.2
1.4
1.1
1.9
Corporate
0.1
0.3
0.1
0.1
0.5
0.1
0.3
0.0
0.0
0.4
0.3
0.6
IDT Consolidated
0.8
2.5
2.1
2.0
7.4
0.9
0.9
0.9
0.4
3.1
2.0
4.2
Previous Measure
National Retail Solutions (NRS)
6.2
6.1
5.6
7.1
25.0
7.6
10.1
7.2
9.3
34.2
10.1
36.7
Fintech
-0.7
0.0
0.2
1.5
1.1
4.0
3.9
5.0
5.5
18.4
7.1
21.6
net2phone
1.4
1.8
2.1
2.5
7.9
2.5
2.9
3.2
3.5
12.1
3.6
13.1
Traditional Communications
18.1
17.0
14.9
16.3
66.3
17.8
20.2
19.3
17.6
75.0
17.7
74.9
Corporate
-2.8
-3.2
-2.3
-2.2
-10.4
-2.9
-3.1
-2.6
-2.5
-11.1
-2.7
-10.9
IDT Consolidated
22.3
21.8
20.6
25.2
89.7
29.1
34.0
32.2
33.4
128.7
35.8
135.5
Reconciliation of Non-GAAP Financial Measures for the First Quarter Fiscal 2026 and 2025
In addition to disclosing financial results that are determined in accordance with generally accepted accounting principles in the United States of America (GAAP), IDT also disclosed (a) Adjusted EBITDA for 1Q26, 4Q25, and 1Q25, among other quarters (b) non-GAAP earnings per diluted share (Non-GAAP EPS) for 1Q26 and 1Q25 (c) NRS’ ‘Rule of 40’ score for 1Q26 and (d) non-GAAP adjusted net cash provided by or used in operating activities for 1Q26 and 1Q25. These are non-GAAP financial measures intended to provide useful information that supplements IDT’s or the relevant segment’s results in accordance with GAAP. The following explains these terms and their respective reconciliations to the most directly comparable GAAP measures.
Generally, a non-GAAP measure is a numerical measure of a company’s performance, financial position, or cash flows that either excludes or includes amounts that are not normally excluded or included in the most directly comparable measure calculated and presented in accordance with GAAP.
IDT’s measure of Adjusted EBITDA starts with net income from operations in accordance with GAAP and adds depreciation and amortization, severance expense, stock-based compensation, and other operating expenses, and deducts other operating income.
IDT’s measure of Non-GAAP EPS is calculated by dividing non-GAAP net income by the diluted weighted-average shares. IDT’s measure of non-GAAP net income starts with net income attributable to IDT in accordance with GAAP and adds severance expense, stock-based compensation, and other operating expenses, and deducts other operating income. These additions and subtractions are non-cash and/or non-routine items in the relevant fiscal 2026 and fiscal 2025 periods.
Management believes that IDT’s Adjusted EBITDA and Non-GAAP EPS are measures which provide useful information to both management and investors by excluding certain expenses and non-routine gains and losses that may not be indicative of IDT’s or the relevant segment’s core operating results. Management uses Adjusted EBITDA, among other measures, as a relevant indicator of core operational strengths in its financial and operational decision making. In addition, management uses Adjusted EBITDA and Non-GAAP EPS to evaluate operating performance in relation to IDT’s competitors. Disclosure of these financial measures may be useful to investors in evaluating performance and allow for greater transparency of the underlying supplemental information used by management in its financial and operational decision-making. In addition, IDT has historically reported similar financial measures and believes such measures are commonly used by readers of financial information in assessing performance, therefore the inclusion of comparative numbers provides consistency in financial reporting.
Management refers to Adjusted EBITDA, as well as the GAAP measures income (loss) from operations and net income, on a segment and/or consolidated level to facilitate internal and external comparisons to the segments’ and IDT’s historical operating results, in making operating decisions, for budget and planning purposes, and to form the basis upon which management is compensated.
While depreciation and amortization are considered operating costs under GAAP, these expenses primarily represent the non-cash current period allocation of costs associated with long-lived assets acquired or capitalized in prior periods. IDT’s Adjusted EBITDA, which is exclusive of depreciation and amortization, is a useful indicator of its current performance.
Severance expense is excluded from the calculation of Adjusted EBITDA and Non-GAAP EPS. Severance expense is reflective of decisions made by management in each period regarding the aspects of IDT’s and its segments’ businesses to be focused on in light of changing market realities and other factors. While there may be similar charges in other periods, the nature and magnitude of these charges can fluctuate markedly and do not reflect the performance of IDT’s core and continuing operations.
Other operating income (expense), net, which is a component of income (loss) from operations, is excluded from the calculation of Adjusted EBITDA and Non-GAAP EPS. Other operating expense, net primarily includes legal fees net of insurance claims related to Straight Path Communications Inc.’s stockholders’ class action, legal settlements, and gains from the write-off of contingent consideration liabilities. From time-to-time, IDT may have gains or incur costs related to non-routine legal, tax, and other matters, however, these various items generally do not occur each quarter. IDT believes the gain and losses from these non-routine matters are not components of IDT’s or the relevant segment’s core operating results.
Stock-based compensation recognized by IDT and other companies may not be comparable because of the variety of types of awards as well as the various valuation methodologies and subjective assumptions that are permitted under GAAP. Stock-based compensation is excluded from IDT’s calculation of Adjusted EBITDA and Non-GAAP EPS because management believes this allows investors to make more meaningful comparisons of the operating results per share of IDT’s core business with the results of other companies. Stock-based compensation continues to be a significant expense for IDT and an important part of employees’ compensation that impacts their performance.
Adjusted EBITDA and Non-GAAP EPS should be considered in addition to, not as a substitute for, or superior to, income (loss) from operations, cash flow from operating activities, net income, basic and diluted earnings per share or other measures of liquidity and financial performance prepared in accordance with GAAP. In addition, IDT’s measurements of Adjusted EBITDA and Non-GAAP EPS may not be comparable to similarly titled measures reported by other companies.
The ‘Rule of 40’ score is a metric used to evaluate the performance of SaaS providers. It postulates that a SaaS provider’s revenue growth rate plus its EBITDA margin should equal or exceed 40 percent. The ‘Rule of 40’ is typically used to assess a company’s balance between growth and profitability. A total of over 40 is thought to indicate a healthy combination of expansion and financial stability, making it a useful tool for management and investors to gauge the potential for long-term success and make informed decisions about resource allocation and business strategy.
NRS’ ‘Rule of 40′ score is computed by adding (a) the growth rate of NRS’ recurring revenue for the relevant period compared to the corresponding year ago period to (b) NRS’ Adjusted EBITDA margin for the twelve-month period through the end of the current period. NRS’ recurring revenue is calculated by subtracting NRS’ revenue from POS terminal sales from its total GAAP revenue. Adjusted EBITDA is a non-GAAP measure as discussed above. Adjusted EBITDA margin is calculated by dividing Adjusted EBITDA by GAAP revenue for the relevant period.
IDT’s Non-GAAP adjusted measure of net cash provided by operating activities is calculated by excluding the impact of changes in customer deposits from net cash provided by operating activities. This measure provides a more meaningful measure of the cash generated by our core business operations, making it a more useful tool for management and investors to evaluate the cash generation of our business operations, and to compare IDT’s cash generation with companies that do not have, or have different levels of, customer deposits. Customer deposits are, by regulation, not available to fund IDT’s operating activities.
Following are reconciliations of Adjusted EBITDA and Non-GAAP EPS to the most directly comparable GAAP measure, which are, (a) for Adjusted EBITDA, (i) income (loss) from operations for IDT’s reportable segments and (ii) net income for IDT on a consolidated basis, and (b) for Non-GAAP EPS, diluted earnings per share. Also following is NRS’ ‘Rule of 40′ score computation including the reconciliation of NRS’ Adjusted EBITDA to the most directly comparable GAAP measure, NRS’ income from operations, and IDT’s Non-GAAP adjusted measure of net cash provided by operating activities reconciled to GAAP net cash provided by operating activities.
IDT Corporation
Reconciliation of Net Income to Adjusted EBITDA for the three months ended 1Q26, 4Q25, and 1Q25
(unaudited) in millions. Figures may not foot or cross-foot due to rounding
Total IDT Corporation
Traditional Comm.
net2phone
NRS
Fintech
Corporate
Three Months Ended October 31, 2025 (1Q26)
Net income attributable to IDT Corporation
$
22.4
Adjustments:
Net income attributable to noncontrolling interests
1.7
Net income
24.1
Provision for income taxes
8.1
Income before income taxes
32.2
Interest income, net
(1.7
)
Other expense, net
0.5
Income (loss) from operations
30.9
$
15.8
$
1.9
$
8.9
$
6.4
$
(2.2
)
Depreciation and amortization
5.3
1.8
1.6
1.1
0.7
–
Stock-based compensation
2.0
1.1
–
0.2
0.3
0.3
Other operating income, net
(0.6
)
(0.1
)
–
–
–
(0.5
)
Severance expense
0.2
0.1
–
–
–
–
Adjusted EBITDA
$
37.9
$
18.7
$
3.6
$
10.3
$
7.5
$
(2.4
)
Total IDT Corporation
Traditional Comm.
net2phone
NRS
Fintech
Corporate
Three Months Ended July 31, 2025 (4Q25)
Net income attributable to IDT Corporation
$
16.9
Adjustments:
Net income attributable to noncontrolling interests
0.6
Net income
17.5
Provision for income taxes
2.9
Income before income taxes
20.4
Interest income, net
(1.8
)
Other expense, net
3.2
Income (loss) from operations
21.9
$
15.4
$
1.5
$
5.8
$
4.8
$
(5.7
)
Depreciation and amortization
5.3
1.8
1.6
1.1
0.7
–
Stock-based compensation
0.4
0.2
–
0.2
–
–
Other operating expense, net
5.9
0.2
0.2
2.4
–
3.1
Severance expense
0.3
0.1
0.1
–
–
–
Adjusted EBITDA
$
33.8
$
17.7
$
3.5
$
9.5
$
5.5
$
(2.5
)
Total IDT Corporation
Traditional Comm.
net2phone
NRS
Fintech
Corporate
Three Months Ended October 31, 2024 (1Q25)
Net income attributable to IDT Corporation
$
17.2
Adjustments:
Net income attributable to noncontrolling interests
1.2
Net income
18.5
Provision for income taxes
6.3
Income before income taxes
24.8
Interest income, net
(1.4
)
Other expense, net
0.3
Income (loss) from operations
23.6
$
15.7
$
1.0
$
6.6
$
3.2
$
(2.9
)
Depreciation and amortization
5.2
2.0
1.6
1.0
0.7
–
Stock-based compensation
0.9
0.6
–
0.2
–
–
Severance expense
0.2
0.2
–
–
–
–
Adjusted EBITDA
$
30.0
$
18.4
$
2.5
$
7.8
$
4.0
$
(2.9
)
IDT Corporation Reconciliation of Earnings Per Share (EPS) to Non-GAAP EPS for 1Q26 and 1Q25 (unaudited) in millions, except per share data. Figures may not foot due to rounding
1Q26
1Q25
Net income attributable to IDT Corporation
$
22.4
$
17.2
Adjustments (add) subtract:
Stock-based compensation
(2.0
)
(0.9
)
Severance expense
(0.2
)
(0.2
)
Other operating income, net
0.6
–
Total adjustments
(1.6
)
(1.1
)
Income tax effect of total adjustments
(0.4
)
(0.2
)
(1.2
)
(0.9
)
Non-GAAP net income
$
23.6
$
18.1
Earnings per share:
Basic
$
0.89
$
0.68
Total adjustments
0.05
0.04
Non-GAAP – basic
$
0.94
$
0.72
Weighted-average number of shares used in calculation of basic earnings per share
25.2
25.2
Diluted
$
0.89
$
0.68
Total adjustments
0.05
0.03
Non-GAAP – diluted
$
0.94
$
0.71
Weighted-average number of shares used in calculation of diluted earnings per share
25.2
25.4
IDT Corporation NRS’ ‘Rule of 40’ Score For 1Q26 (unaudited) in millions. Figures may not foot due to rounding to millions
1Q26
4Q25
3Q25
2Q25
Trailing Twelve Months (TTM) 1Q26
Reconciliation of NRS’ Income from Operations to Adjusted EBITDA
Income from operations
$
8.9
$
5.8
$
6.2
$
9.1
$
30.0
Depreciation and amortization
1.1
1.1
1.0
1.0
4.2
Stock-based compensation
0.2
0.2
0.6
0.2
1.2
Other operating expense, net
–
2.4
–
–
2.4
Adjusted EBITDA
$
10.3
$
9.5
$
7.8
$
10.3
$
37.9
1Q26
1Q25
NRS’ ‘Rule of 40’ Score
NRS recurring revenue
$
35.3
$
28.9
NRS other revenue
1.8
1.4
NRS total revenue
$
37.1
$
30.4
NRS recurring revenue growth rate
22
%
NRS TTM Adjusted EBITDA from above
$
37.9
NRS TTM total revenue
135.5
NRS TTM Adjusted EBITDA margin
28
%
Rule of 40
50
%
IDT Corporation
Adjusted net cash provided by operating activities for 1Q26 and 1Q25
(unaudited) in millions. Figures may not foot due to rounding to millions
(in millions) Three months ended October 31
Q126
Q125
Net cash provided by operating activities (GAAP)
$
(10.1
)
$
0.2
Changes in customer deposits
10.6
2.8
Adjusted net cash provided by operating activities (non-GAAP)
$
(22.7
)
$
(2.6)
Explanation of Key Performance Metrics
net2phone’s subscription revenue is calculated by subtracting net2phone’s equipment revenue and revenue generated by a legacy SIP trunking offering in Brazil from its revenue in accordance with GAAP. net2phone’s cloud communications and contact center offerings are priced on a per-seat basis, with customers paying based on the number of users in their organization. The number of seats served and subscription revenue trends and comparisons between periods are used in the analysis of net2phone’s revenues and direct cost of revenues and are strong indications of the top-line growth and performance of the business.
NRS’ Monthly Average Recurring Revenue per Terminal is calculated by dividing NRS’ recurring revenue as defined in the Reconciliation of Non-GAAP Financial Measures by the average number of active POS terminals during the period. The average number of active POS terminals is calculated by adding the beginning and ending number of active POS terminals during the period and dividing by two. NRS’ recurring revenue divided by the average number of active POS terminals is divided by three when the period is a fiscal quarter. Recurring revenue and Monthly Average Recurring Revenue per Terminal are useful for comparisons of NRS’ revenue and revenue per customer to prior periods and to competitors and others in the market, as well as for forecasting future revenue from the customer base.
BOSS Money transactions are a nonfinancial metric that measures customer usage during a reporting period. BOSS Money’s digital send volume is the aggregate amount of principal remitted by BOSS Money’s digital customers – those using the BOSS Money and BOSS Revolutions apps to originate remittances. Digital send volume is a key metric for evaluating the operational performance of the digital channel of the remittance business, and for comparing the performance of BOSS Money’s digital channel to competitors in the remittance business as well as to performance to other temporal periods.
# # #
Delaware Supreme Court Affirms Court of Chancery’s Dismissal of Claims Against IDT Related to Straight Path Communications Sale to Verizon
NEWARK, NJ, Dec. 03, 2025 (GLOBE NEWSWIRE) — IDT Corporation (NYSE: IDT), a global provider of fintech and communications services, commented on the decision issued today by the Delaware Supreme Court affirming the Court of Chancery’s post-trial decision dismissing all claims against IDT and finding no harm to Straight Path Communications Inc. (“Straight Path”) shareholders.
“We are very pleased by today’s decision from the Delaware Supreme Court, which puts to rest this lawsuit by affirming the post-trial decision of the Court of Chancery. That decision dismissed all claims against IDT and found that contrary to the plaintiff’s claims, Straight Path’s stockholders did not incur any damages whatsoever,” said Shmuel Jonas, IDT’s CEO. “We have said all along that this class action suit was without merit, and today’s decision upholding the Court of Chancery’s decision vindicates IDT’s position.”
Straight Path was spun off from IDT in 2013 and, in 2017, was sold to Verizon Communications for $3.1 billion. The Court of Chancery’s ruling came in a class action suit filed in 2017 by plaintiffs on behalf of the former stockholders of the Company’s former subsidiary, Straight Path.
All statements above that are not purely about historical facts, including, but not limited to, those in which we use the words “believe,” “anticipate,” “expect,” “plan,” “intend,” “estimate,” “target” and similar expressions, are forward-looking statements within the meaning of the Private Securities Litigation Reform Act of 1995. While these forward-looking statements represent our current judgment of what may happen in the future, actual results may differ materially from the results expressed or implied by these statements due to numerous important factors. Our filings with the SEC provide detailed information on such statements and risks and should be consulted along with this release. To the extent permitted under applicable law, IDT assumes no obligation to update any forward-looking statements.
ABOUT IDT CORPORATION
IDT Corporation (NYSE: IDT) is a global provider of fintech and communications solutions through a portfolio of synergistic businesses: National Retail Solutions (NRS), through its point-of-sale (POS) platform, enables independent retailers to operate more effectively while providing advertisers and marketers with unprecedented reach into underserved consumer markets; BOSS Money facilitates innovative international remittances and fintech payments solutions; net2phone provides enterprises and organizations with intelligently integrated cloud communications and contact center services across channels and devices; IDT Digital Payments and the BOSS Revolution calling service make sharing prepaid products and services and speaking with friends and family around the world convenient and reliable; and, IDT Global and IDT Express enable communications services to provision and manage international voice and SMS messaging.