NRSInsights’ March 2025 Retail Same-Store Sales Report
March same-store sales increased 2.3% year-over-year*
NEWARK, N.J., April 07, 2025 (GLOBE NEWSWIRE) — NRSInsights, a provider of sales data and analytics drawn from retail transactions processed through the National Retail Solutions (NRS) point-of-sale (POS) platform, today announced comparative retail same-store sales results for March 2025.
As of March 31, 2025, the NRS retail network comprised approximately 35,200 active terminals nationwide, scanning purchases at approximately 30,700 independent retailers including convenience stores, bodegas, liquor stores, grocers, and tobacco and sundries sellers, predominantly serving urban consumers.
March Highlights*
(*Same-store sales, unit sales, transactions, and average price data refer to March 2025 and are compared to March 2024 unless otherwise noted. All comparisons are provided on a “per calendar day” basis to remove from consideration variability in the number of days per month or three-month period.)
SALES
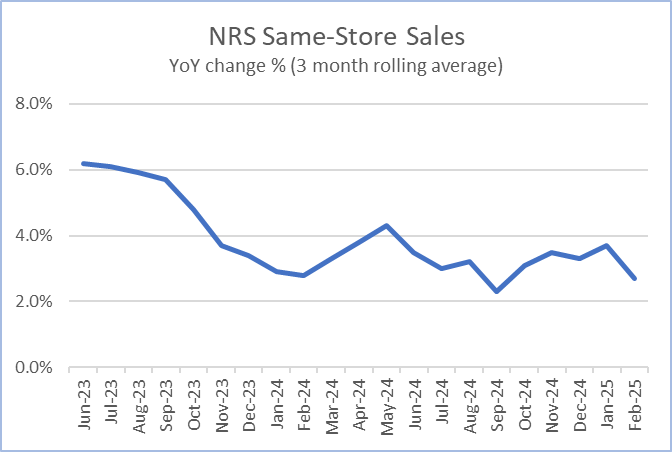
Same-store sales increased 2.3% year-over-year. In the previous month (February 2025), same-store sales had increased 3.5% year-over-year.
Same-store sales increased 5.3% compared to the previous month (February 2025). Same-store sales in February 2025 had increased 6.1% compared to the previous month (January 2025).
For the three months ended March 31, 2025, same-store sales increased 2.9% compared to the corresponding three months a year ago.
UNITS SOLD
Units sold increased 2.4% year-over-year. In the previous month (February 2025), units sold had increased 3.0% year-over-year.
Units sold increased 4.9% compared to the previous month (February 2025). Units sold in February 2025 had increased 5.0% compared to the previous month (January 2025).
BASKETS (TRANSACTIONS) PER STORE
Baskets increased 0.2% year-over-year. In the previous month (February 2025), baskets had decreased (0.9)% year-over-year.
Baskets increased 6.2% compared to the previous month (February 2025). Baskets in February 2025 had increased 4.6% compared to the previous month (January 2025).
AVERAGE PRICES
A dollar-weighted average of prices for the top 500 items purchased increased 2.1% year-over-year, a lower rate of increase than the 2.3% increase recorded in February 2025.
Retail Trade Comparative Data
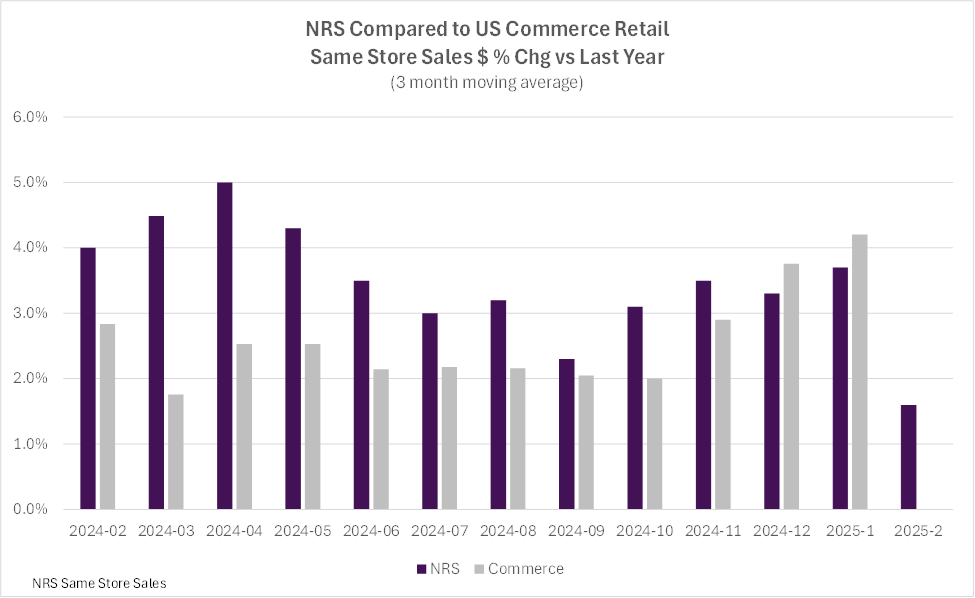
The table below provides historical comparative data with the U.S. Commerce Department’s Advance Monthly Retail Trade same-store sales data excluding food service:
Over the past twelve months, the NRS network’s three-month moving average same-store sales have outpaced the US Commerce Department’s Advance Monthly Retail Trade data, excluding food services, by 0.8% on average. In March, the Department’s three month rolling average increase exceeded the NRS network’s by 0.8%.
The NRSInsights data in the chart above have not been adjusted to reflect inflation, demographic distributions, seasonal buying patterns, item substitution, days per month, or other factors that may facilitate comparisons to other periods, to other same-store retail sales data, or to the U.S. Commerce Department’s retail data.
Commentary from Suzy Silliman (SVP, Data Strategy and Sales at NRS)
“The NRS network delivered a solid year-over-year increase in dollar sales for same-store scanning in March 2025. The increase was geographically widespread, with most DMAs, including twelve of the top fifteen, attaining sales increases. Inflationary pressures, meanwhile, continued to cool.
“Categories showing dollar sales strength in March included Energy Beverages, which maintained its recent momentum, and Soft Drinks. The Modern Oral Smokeless Tobacco segment also had a notably strong month while still enjoying potential upside through expanded distribution.
“Chocolates also had another good month after an impressive February (including Valentine’s Day). Gum, which last month suffered its first year-over-year decrease in over a year, rebounded in March with strong year-over-year growth.
“Categories with decreased sales included most of the leaders within the BEVAL super-category — including Beer, FMB/Cider/Seltzer, Whiskey, Vodka, and Still Wine. Tequila was the notable exception, achieving both dollar and unit sales gains.
“The Salty Snack super category, led by Tortilla Chips, Potato Chips and Corn Chips, recorded a double-digit year-over-year sales decrease in March after a more moderate decline in February. Confections sales also continued to decrease compared to the year ago.”
NRSInsights Reports
The NRSInsights monthly Same-Store Retail Sales Reports are intended to provide timely topline data reflective of sales at NRS’ network of independent, predominantly urban, retail stores.
Same-store data comparisons of March 2025 with March 2024 are derived from approximately 207 million transactions processed through the approximately 21,500 stores on the NRS network that scanned transactions in both months. Same-store data comparisons of March 2025 with February 2025 are derived from approximately 241 million transactions processed through approximately 29,600 stores.
Same-store data comparisons for the three months ended March 31, 2025 with the year-ago three months are derived from approximately 551 million scanned transactions processed through those stores that scanned transactions in both three-month periods.
NRS POS Platform
The NRS platform predominantly serves small-format, independent, retail stores nationwide including convenience stores, bodegas, liquor stores, grocers, and tobacco and sundries sellers. These independent retailers operate in all 50 states as well as the District of Columbia, and in 204 of the 210 designated market areas (DMAs) in the United States. During March 2025, NRS’ POS terminals processed $2.0 billion in sales (+16% year-over-year) across 134 million transactions (+% year-over-year).
About National Retail Solutions (NRS):
National Retail Solutions operates the largest point-of-sale (POS) terminal-based platform and digital payment processing service for independent retailers nationwide. Retailers utilize NRS offerings to process transactions and effectively manage their businesses. Consumer packaged goods (CPG) suppliers, brokers, analytics firms, and advertisers access the terminal’s digital display network to reach these retailers’ predominantly urban, multi-cultural shopper base, and to harness transaction data-based learnings to identify growth opportunities and measure execution and returns on marketing investment. NRS is a subsidiary of IDT Corporation (NYSE: IDT).
All statements above that are not purely about historical facts, including, but not limited to, those in which we use the words “believe,” “anticipate,” “expect,” “plan,” “intend,” “estimate,” “target” and similar expressions, are forward-looking statements within the meaning of the Private Securities Litigation Reform Act of 1995. While these forward-looking statements represent our current judgment of what may happen in the future, actual results may differ materially from the results expressed or implied by these statements due to numerous important factors. Our filings with the SEC provide detailed information on such statements and risks, and should be consulted along with this release. To the extent permitted under applicable law, IDT assumes no obligation to update any forward-looking statements.
NRSInsights Contact: Suzy Silliman SVP, Data Strategy and Sales at NRS National Retail Solutions suzy.silliman@nrsplus.com
BOSS Revolution Announces Savings Pass – A Monthly Membership Plan
Savings Pass, along with BOSS Unlimited and Bundles of Minutes monthly calling plans, offer spectacular savings no matter where you call or how long you talk
NEWARK, NJ, April 03, 2025 (GLOBE NEWSWIRE) — BOSS Revolution, the popular provider of affordable long distance calling to friends and family around the world powered by IDT Corporation (NYSE: IDT), has introduced Savings Pass – a monthly membership calling plan.
“Just as the big box discount stores offer big savings to their club members, BOSS Revolution’s Savings Pass is an affordable monthly plan that provides our customers with big discounts on our international long-distance calling rates — no matter where you call or how long you talk,” said Jessica Poverene, EVP Marketing at BOSS Revolution.
BOSS Revolution’s Savings Pass provides a 20% discount on BOSS Revolution’s already low standard rates when calling any one of over 200 countries. The Saving Pass plan is just $5 per month.
BOSS Revolution Savings Pass is just one way BOSS Revolution rewards its customers. Other BOSS Revolution monthly subscription offerings include:
Unlimited Plans – Provide unlimited calling to Mexico, Canada, the United Kingdom and popular destinations in Europe, South America, and the Caribbean.
Bundles of Minutes Plans – Provide a fixed number of minutes for calls to over 40 countries at a 20% discount off BOSS Revolution’s standard rates for a month. Popular destinations in Latin America and the Caribbean include: Guatemala, Honduras, El Salvador, the Dominican Republic, Haiti, and Jamaica. Popular African destinations include Nigeria, Burkina Faso, Ghana, Togo, Liberia, and Somalia.
BOSS Revolution Savings Pass and Unlimited Plans maximize savings for those calling overseas most frequently. BOSS Revolution customers who consistently stay in touch with friends and family but who call less frequently or who make shorter calls will generate their biggest savings from Bundles of Minutes subscription plans.
Charles Thibault, Executive Vice-President, said, “The global paid-minute communications market is a complex eco-system of overlapping prices. Our new Savings Pass option, together with our Unlimited and Bundles of Minutes calling plans, help you cut through that complexity to easily get the best deal possible based on your needs. No matter which calling plan you choose, you will find significant savings.”
About BOSS Revolution
Boss Revolution is a trusted brand that makes calling friends and family around the world more convenient and reliable. BOSS Revolution is a brand of IDT Corporation
About IDT Corporation
IDT Corporation (NYSE: IDT) is a global provider of fintech and communications solutions through a portfolio of synergistic businesses: National Retail Solutions (NRS), through its point-of-sale (POS) platform, enables independent retailers to operate more effectively while providing advertisers and marketers with unprecedented reach into underserved consumer markets;BOSS Money facilitates innovative international remittances and fintech payments solutions;net2phone provides enterprises and organizations with intelligently integrated cloud communications and contact center services across channels and devices; IDT Digital Payments and the BOSS Revolution calling service make sharing prepaid products and services and speaking with friends and family around the world convenient and reliable; and, IDT Global and IDT Express enable communications services to provision and manage international voice and SMS messaging.
IDT Corporation to Present at Sidoti Investor Conference
NEWARK, NJ, March 18, 2025 — IDT Corporation (NYSE: IDT), a global provider of fintech, cloud communications, and traditional communications solutions, will present at the Sidoti Virtual Investor Conference that will be held on March 19th and 20th, 2025.
Marcelo Fisher, Chief Financial Officer, will present at 10:45 AM Eastern time on Wednesday, March 19th. His presentation will provide an overview of IDT’s operations, strategy, and financial results. Mr. Fischer will also host one-on-one investor meetings throughout both days of the conference.
To register for the presentation or one-on-ones, visit www.sidoti.com/events. Registration is free.
All statements above that are not purely about historical facts, including, but not limited to, those in which we use the words “believe,” “anticipate,” “expect,” “plan,” “intend,” “estimate,” “target” and similar expressions, are forward-looking statements within the meaning of the Private Securities Litigation Reform Act of 1995. While these forward-looking statements represent our current judgment of what may happen in the future, actual results may differ materially from the results expressed or implied by these statements due to numerous important factors. Our filings with the SEC provide detailed information on such statements and risks, and should be consulted along with this release. To the extent permitted under applicable law, IDT assumes no obligation to update any forward-looking statements.
ABOUT IDT CORPORATION
IDT Corporation (NYSE: IDT) is a global provider of fintech and communications solutions through a portfolio of synergistic businesses: National Retail Solutions (NRS), through its point-of-sale (POS) platform, enables independent retailers to operate more effectively while providing advertisers and marketers with unprecedented reach into underserved consumer markets; BOSS Money facilitates innovative international remittances and fintech payments solutions; net2phone provides enterprises and organizations with intelligently integrated cloud communications and contact center services across channels and devices; IDT Digital Payments and the BOSS Revolution calling service make sharing prepaid products and services and speaking with friends and family around the world convenient and reliable; and, IDT Global and IDT Express enable communications services to provision and manage international voice and SMS messaging.
IDT Corporation Reports Record Second Quarter 2025 Results
Record levels of gross profit +16%; income from operations +77%; Adjusted EBITDA* +56%
GAAP EPS increased to $0.80 from $0.57; Non-GAAP EPS* increased to $0.84 from $0.67
IDT raised its quarterly dividend 20% to 6 cents
NEWARK, NJ, March 06, 2025 — IDT Corporation (NYSE: IDT), a global provider of fintech, cloud communications, and traditional communications solutions, today reported results for its second quarter fiscal year 2025, the three months ended January 31, 2025.
SECOND QUARTER HIGHLIGHTS
(Throughout this release, unless otherwise noted, results for the second quarter of fiscal year 2025 (2Q25) are compared to the second quarter of fiscal year 2024 (2Q24). All earnings per share (EPS) and other ‘per share’ results are per diluted share.
Key Businesses / Segments
NRS
Recurring revenue**: +32% to $31.6 million;
Income from operations: +71% to $9.1 million;
Adjusted EBITDA: +65% to $10.1 million;
‘Rule of 40’ score**: 55
BOSS Money / Fintech segment
BOSS Money transactions: +36% to 5.7 million;
BOSS Money revenue: +34% to $33.5 million;
Fintech segment gross profit: +35% to $21.7 million;
Fintech segment income from operations: increased to $3.1 million from a loss of $(0.7) million;
Fintech segment Adjusted EBITDA: increased to $3.9 million from a loss of $(12) thousand;
net2phone
Subscription revenue**: +9% to $21.0 million (+14% on a constant currency basis);
Income from operations: increased to $1.1 million from $0.4 million;
Adjusted EBITDA: +55% to $2.9 million;
Traditional Communications
Gross profit: +2% to $43.1 million;
Income from operations: +24% to $18.1 million;
Adjusted EBITDA: +19% to $20.2 million;
IDT Consolidated
Revenue: +2% to $303.3 million;
Gross profit (GP) / margin: GP +16% to $112 million; GP margin +420 bps to 37.0%;
Income from operations: +77% to $28.3 million;
Net income attributable to IDT: +41% to $20.3 million;
GAAP EPS: Increased to $0.80 from $0.57;
Non-GAAP net income: +26% to $21.3 million;
Non-GAAP EPS: Increased to $0.84 from $0.67;
Adjusted EBITDA: +56% to $34.0 million;
CapEx: +6% to $4.8 million;
Stock buyback: Repurchased 179,338 shares of IDT Class B common stock in market transactions during 2Q25 for $8.5 million at an average share price of $47.59;
Common stock dividend: IDT increased its quarterly dividend from $0.05 to $0.06.
REMARKS BY SHMUEL JONAS, CEO
“IDT had a strong second quarter led by NRS and BOSS Money, and supported by robust results from our Traditional Communications segment, which increased its cash generation for the third consecutive quarter. On a consolidated basis, we again generated record levels of gross profit, income from operations, and Adjusted EBITDA.
“NRS continued to deepen its penetration of the independent retailer market. We are now launching new features and functionalities that increase the value of our solution for retailers and will help us to drive additional growth.
“BOSS Money delivered another quarter of strong year-over-year transaction and revenue growth. In the second quarter, we continued to focus on improving the margin contribution, particularly in our retail channel, and that effort helped to boost our Fintech segment’s gross profit and Adjusted EBITDA less CapEx to record levels.
“net2phone continued its expansion led by further growth in the U.S. market. We are especially excited about last week’s launch of net2phone’s virtual AI agent. It has been very well received by our internal BOSS and NRS teams that are using it with great success to enhance the quality and consistency of customer interactions while reducing costs. We are confident that net2phone clients will find that it provides them with great value right out of the gate. Moreover, as they build with our AI agent, it will provide clients with increasingly sophisticated, tailored solutions that add value across disparate functions within their organizations.
“Our Traditional Communications segment increased Adjusted EBITDA for the third sequential quarter and surpassed $20 million for the first time since fiscal 2022.
“In light of our solid financial position and positive outlook, and mindful of the feedback we’ve received from our investors, we stepped up our repurchases of stock during the second quarter and have increased our regular quarterly dividend by 20%.”
2Q25 RESULTS BY SEGMENT
(For all periods presented, capital expenditures (CapEx), previously provided on a consolidated basis, is now also provided for each business segment.)
National Retail Solutions (NRS)
National Retail Solutions (NRS) (Terminals and accounts at end of period. $ in millions, except for average revenue per terminal)
2Q25
1Q25
2Q24
2Q25-2Q24 (% Δ)
Terminals and payment processing accounts
Active POS terminals
34,800
33,100
28,700
+21
%
Payment processing accounts
23,900
22,700
18,200
+32
%
Recurring revenue
Merchant Services & Other
$
18.1
$
17.2
$
12.5
+45
%
Advertising & Data
$
10.0
$
8.5
$
8.7
+15
%
SaaS Fees
$
3.5
$
3.3
$
2.7
+30
%
Total recurring revenue
$
31.6
$
28.9
$
23.9
+32
%
POS terminal sales
$
1.3
$
1.4
$
1.3
+2
%
Total revenue
$
33.0
$
30.4
$
25.2
+31
%
Monthly average recurring revenue per terminal**
$
310
$
295
$
285
+9
%
Gross profit
$
30.3
$
27.6
$
22.5
+35
%
Gross profit margin
91.8
%
91.0
%
89.1
%
+270
bps
Technology & development
$
2.2
$
2.0
$
1.9
+14
%
SG&A
$
19.0
$
19.0
$
15.2
+25
%
Income from operations
$
9.1
$
6.6
$
5.3
+71
%
Adjusted EBITDA
$
10.1
$
7.6
$
6.1
+65
%
CapEx
$
0.9
$
1.2
$
1.0
(4
)%
NRS Take-Aways / Updates:
NRS added approximately 1,700 net active terminals and approximately 1,200 net payment processing accounts during 2Q25. Net active terminal additions included the impact of approximately 300 terminals operating in seasonal stores that suspended operations following the quarter close.
The 45% year-over-year increase in Merchant Services & Other revenue was driven by the growth in payment processing accounts, and higher merchant services revenue per account, driven in part by the increased percentage of retail transactions paid with a credit or debit card.
The 30% year-over-year increase in SaaS Fees revenue reflects the growth of net active terminals and migration of retailers to premium SaaS plans.
Fintech
Fintech (Transactions in millions. $ in millions, except for average revenue per transaction)
2Q25
1Q25
2Q24
2Q25-2Q24 (% Δ, $)
BOSS Money transactions
5.7
5.6
4.2
+36
%
Fintech Revenue
BOSS Money
$
33.5
$
33.7
$
25.0
+34
%
Other
$
3.3
$
3.4
$
2.9
+13
%
Total Revenue
$
36.8
$
37.1
$
28.0
+32
%
Average revenue per BOSS Money transaction**
$
5.87
$
6.01
$
5.98
$
(0.11
)
Gross profit
$
21.7
$
21.6
$
16.1
+35
%
Gross profit margin
58.9
%
58.2
%
57.5
%
140
bps
Technology & development
$
2.3
$
2.3
$
2.5
(8
)%
SG&A
$
16.3
$
16.1
$
14.3
+14
%
Income (loss) from operations
$
3.1
$
3.2
$
(0.7
)
+$3.8
Adjusted EBITDA
$
3.9
$
4.0
$
0
+$3.9
CapEx
$
0.8
$
1.1
$
0.8
+1
%
Fintech Take-Aways:
The 36% increase in BOSS Money transactions reflected a 40% year-over-year increase in digital transactions and a 22% increase in retail transactions.
BOSS Money revenue increased 34% year-over-year driven by a 38% year-over-year increase in digital channel revenue. The 1% sequential decrease in revenue reflected BOSS Money’s continued focus on expanding per-transaction margins, particularly at retail, which boosted gross profit while dampening transaction volume growth and revenue.
The strong increases in the Fintech segment’s income from operations and Adjusted EBITDA were driven by BOSS Money revenue growth, higher margins on BOSS Money transactions and improved operating leverage as the business continues to scale.
BOSS Money continued to expand to new destinations during 2Q25 (Venezuela and Eritrea) with Brazil expected to come online in 3Q25. BOSS Money also launched debit card payment capabilities at BOSS Money retailers across the U.S. and continued to build out its already extensive payout network in key destination markets.
net2phone
net2phone (Seats in thousands at end of period. $ in millions)
2Q25
1Q25
2Q24
2Q25-2Q24 (% Δ, $)
Seats**
410
406
375
+9
%
Revenue
Subscription revenue
$
21.0
$
21.0
$
19.3
+9
%
Other revenue
$
0.5
$
0.6
$
1.0
(54
)%
Total Revenue
$
21.5
$
21.6
$
20.4
+6
%
Gross profit
$
17.0
$
17.1
$
16.1
+6
%
Gross profit margin
79.2
%
79.0
%
78.9
%
20
bps
Technology & development
$
2.8
$
3.0
$
2.6
+5
%
SG&A
$
13.0
$
13.1
$
13.1
(1
)%
Income from operations
$
1.1
$
1.0
$
0.4
+201
%
Adjusted EBITDA
$
2.9
$
2.5
$
1.8
+55
%
CapEx
$
1.8
$
1.6
$
1.4
+28
%
net2phone Take-Aways:
The 9% year over year increase in total seats served was powered by continued expansion in key markets led by the U.S., Brazil, and Mexico. CCaaS seats served increased by 10% year-over year.
Subscription revenue increased by 9% year-over-year. The increase reflected net seat growth and increased subscription revenue per seat** in the U.S., offset by the negative FX impact of a strengthened U.S. dollar versus local currencies in net2phone’s key Latin American markets. On a constant currency basis, subscription revenue increased by 14% year over year.
Operating margin** increased to 5% from 2% in 2Q24, and Adjusted EBITDA margin** increased to 13% from 9% in 2Q24. Additional steady margin improvement remains a key strategic focus.
Following the quarter close, net2phone launched its AI agent, a scalable virtual assistant providing exceptional customer experiences across sales, support, and administrative tasks.
Traditional Communications
Traditional Communications ($ in millions)
2Q25
1Q25
2Q24
2Q25-2Q24 (% Δ)
Revenue
IDT Digital Payments
$
101.6
$
105.1
$
99.7
+2
%
BOSS Revolution
$
53.3
$
56.8
$
66.7
(20
)%
IDT Global
$
51.3
$
52.4
$
48.7
+5
%
Other
$
5.9
$
6.2
$
7.5
(22
)%
Total Revenue
$
212.0
$
220.5
$
222.5
(5
)%
Gross profit
$
43.1
$
41.3
$
42.3
+2
%
Gross profit margin
20.3
%
18.8
%
19.0
%
+130
bps
Technology & development
$
5.4
$
5.5
$
5.9
(9
)%
SG&A
$
19.4
$
20.0
$
21.4
(9
)%
Income from operations
$
18.1
$
15.7
$
14.6
+24
%
Adjusted EBITDA
$
20.2
$
17.8
$
17.0
+19
%
CapEx
$
1.2
$
1.4
$
1.4
(8
)%
Take-Aways:
IDT Global continues to mitigate the impacts of the ongoing industry-wide declines in paid-minute voice through a traffic mix shift to higher margin routes, new service offerings, and operational efficiencies.
For the third consecutive quarter, Traditional Communications’ income from operations and Adjusted EBITDA both increased sequentially. In 2Q25, the increases were driven by increasing gross profit contributions from each of the three major lines of business, as well as by continued efforts to streamline operations and remove costs.
OTHER FINANCIAL RESULTS
Consolidated results for all periods presented include corporate overhead. In 2Q25, Corporate G&A expense decreased to $3.0 million from $3.2 million in 2Q24.
As of January 31, 2025, IDT held $171.1 million in cash, cash equivalents, debt securities, and current equity investments. Also at January 31, 2025, current assets totaled $462.1 million and current liabilities totaled $278.2 million. The Company had no outstanding debt at the quarter end.
Net cash provided by operating activities decreased to $20.2 million in 2Q25 from $28.4 million in 2Q24. Exclusive of changes in customer funds deposits at IDT’s Fintech segment, net cash provided by operating activities decreased to $7.3 million in 2Q25 from $25.4 million in 2Q24. This decrease predominantly reflects the timing of payments made by IDT to cover anticipated BOSS Money disbursement prefunding.
Capital expenditures increased to $4.8 million in 2Q25 from $4.6 million in 2Q24.
IDT EARNINGS ANNOUNCEMENT INFORMATION
This release is available for download in the “Investors & Media” section of the IDT Corporation website (https://www.idt.net/investors-and-media) and has been filed on a current report (Form 8-K) with the SEC.
IDT will host an earnings conference call beginning at 5:30 PM Eastern today with management’s discussion of results followed by Q&A with investors. To listen to the call and participate in the Q&A, dial 1-888-506-0062 (toll-free from the US) or 1-973-528-0011 (international) and provide the following access code: 145736.
A replay of the conference call will be available approximately three hours after the call concludes through March 20, 2025. To access the call replay, dial 1-877-481-4010 (toll-free from the US) or 1-919-882-2331 (international) and provide this replay passcode: 51975. The replay will also be accessible via streaming audio at the IDT investor relations website.
NOTES
*Adjusted EBITDA and Non-GAAP EPS are Non-GAAP financial measures intended to provide useful information that supplements IDT’s or the relevant segment’s results in accordance with GAAP. Please refer to the Reconciliation of Non-GAAP Financial Measures later in this release for an explanation of these terms and their respective reconciliations to the most directly comparable GAAP measures.
**See ‘Explanation of Key Performance Metrics’ at the end of this release.
ABOUT IDT CORPORATION
IDT Corporation (NYSE: IDT) is a global provider of fintech and communications solutions through a portfolio of synergistic businesses: National Retail Solutions (NRS), through its point-of-sale (POS) platform, enables independent retailers to operate more effectively while providing advertisers and marketers with unprecedented reach into underserved consumer markets; BOSS Money facilitates innovative international remittances and fintech payments solutions; net2phone provides enterprises and organizations with intelligently integrated cloud communications and contact center services across channels and devices; IDT Digital Payments and the BOSS Revolution calling service make sharing prepaid products and services and speaking with friends and family around the world convenient and reliable; and, IDT Global and IDT Express enable communications services to provision and manage international voice and SMS messaging.
All statements above that are not purely about historical facts, including, but not limited to, those in which we use the words “believe,” “anticipate,” “expect,” “plan,” “intend,” “estimate,” “target” and similar expressions, are forward-looking statements within the meaning of the Private Securities Litigation Reform Act of 1995. While these forward-looking statements represent our current judgment of what may happen in the future, actual results may differ materially from the results expressed or implied by these statements due to numerous important factors. Our filings with the SEC provide detailed information on such statements and risks and should be consulted along with this release. To the extent permitted under applicable law, IDT assumes no obligation to update any forward-looking statements.
Trade accounts receivable, net of allowance for credit losses of $7,295 at January 31, 2025 and $6,352 at July 31, 2024
45,127
42,215
Settlement assets, net of reserve of $1,804 at January 31, 2025 and $1,866 at July 31, 2024
41,779
22,186
Disbursement prefunding
57,676
30,736
Prepaid expenses
15,989
17,558
Other current assets
24,914
25,927
Total current assets
462,134
422,525
Property, plant, and equipment, net
38,380
38,652
Goodwill
26,149
26,288
Other intangibles, net
5,583
6,285
Equity investments
6,748
6,518
Operating lease right-of-use assets
2,498
3,273
Deferred income tax assets, net
22,333
35,008
Other assets
11,903
11,546
Total assets
$
575,728
$
550,095
Liabilities, redeemable noncontrolling interest, and equity
Current liabilities:
Trade accounts payable
$
22,482
$
24,773
Accrued expenses
89,472
103,176
Deferred revenue
28,384
30,364
Customer funds deposits
104,720
91,893
Settlement liabilities
16,975
12,764
Other current liabilities
16,157
16,374
Total current liabilities
278,190
279,344
Operating lease liabilities
1,349
1,533
Other liabilities
1,093
2,662
Total liabilities
280,632
283,539
Commitments and contingencies
Redeemable noncontrolling interest
11,228
10,901
Equity:
IDT Corporation stockholders’ equity:
Preferred stock, $.01 par value; authorized shares-10,000; no shares issued
–
–
Class A common stock, $.01 par value; authorized shares-35,000; 3,272 shares issued and 1,574 shares outstanding at January 31, 2025 and July 31, 2024
33
33
Class B common stock, $.01 par value; authorized shares-200,000; 28,233 and 28,177 shares issued and 23,491 and 23,684 shares outstanding at January 31, 2025 and July 31, 2024, respectively
282
282
Additional paid-in capital
306,781
303,510
Treasury stock, at cost, consisting of 1,698 and 1,698 shares of Class A common stock and 4,742 and 4,493 shares of Class B common stock at January 31, 2025 and July 31, 2024, respectively
(137,475
)
(126,080
)
Accumulated other comprehensive loss
(19,599
)
(18,142
)
Retained earnings
121,573
86,580
Total IDT Corporation stockholders’ equity
271,595
246,183
Noncontrolling interests
12,273
9,472
Total equity
283,868
255,655
Total liabilities, redeemable noncontrolling interest, and equity
$
575,728
$
550,095
IDT CORPORATION CONSOLIDATED STATEMENTS OF INCOME (Unaudited)
Three Months Ended January 31,
Six Months Ended January 31,
2025
2024
2025
2024
(in thousands, except per share data)
Revenues
$
303,349
$
296,098
$
612,915
$
597,302
Direct cost of revenues
191,239
199,171
393,178
406,382
Gross profit
112,110
96,927
219,737
190,920
Operating expenses (gain):
Selling, general and administrative (i)
70,721
67,346
141,772
131,723
Technology and development (i)
12,612
12,925
25,372
25,335
Severance
233
345
410
869
Other operating expense (gain), net
227
294
227
(190
)
Total operating expenses
83,793
80,910
167,781
157,737
Income from operations
28,317
16,017
51,956
33,183
Interest income, net
1,354
1,195
2,782
2,039
Other income (expense), net
207
2,534
(76
)
(3,053
)
Income before income taxes
29,878
19,746
54,662
32,169
Provision for income taxes
(7,665
)
(3,992
)
(13,967
)
(7,939
)
Net income
22,213
15,754
40,695
24,230
Net income attributable to noncontrolling interests
(1,944
)
(1,329
)
(3,178
)
(2,146
)
Net income attributable to IDT Corporation
$
20,269
$
14,425
$
37,517
$
22,084
Earnings per share attributable to IDT Corporation common stockholders:
Basic
$
0.81
$
0.57
$
1.49
$
0.88
Diluted
$
0.80
$
0.57
$
1.48
$
0.87
Weighted-average number of shares used in calculation of earnings per share:
Basic
25,161
25,175
25,182
25,176
Diluted
25,324
25,317
25,343
25,297
(i) Stock-based compensation included in:
Selling, general and administrative expense
$
768
$
2,357
$
1,602
$
2,998
Technology and development expense
$
95
$
130
$
172
$
260
IDT CORPORATION CONSOLIDATED STATEMENTS OF CASH FLOWS (Unaudited)
Six Months Ended January 31,
2025
2024
(in thousands)
Operating activities
Net income
$
40,695
$
24,230
Adjustments to reconcile net income to net cash provided by operating activities:
Depreciation and amortization
10,490
10,146
Deferred income taxes
12,674
5,787
Provision for credit losses, doubtful accounts receivable, and reserve for settlement assets
2,472
1,696
Stock-based compensation
1,774
3,258
Other
1,077
2,829
Changes in assets and liabilities:
Trade accounts receivable
(4,978
)
(7,040
)
Settlement assets, disbursement prefunding, prepaid expenses, other current assets, and other assets
(46,244
)
9,966
Trade accounts payable, accrued expenses, settlement liabilities, other current liabilities, and other liabilities
(11,844
)
(6,200
)
Customer funds deposits
15,701
15
Deferred revenue
(1,500
)
(1,381
)
Net cash provided by operating activities
20,317
43,306
Investing activities
Capital expenditures
(10,100
)
(8,885
)
Purchase of convertible preferred stock in equity method investment
(673
)
(1,009
)
Purchases of debt securities and equity investments
(15,997
)
(19,357
)
Proceeds from maturities and sales of debt securities and redemption of equity investments
16,751
31,231
Net cash (used in) provided by investing activities
(10,019
)
1,980
Financing activities
Dividends paid
(2,524
)
–
Distributions to noncontrolling interests
(50
)
(59
)
Proceeds from borrowings under revolving credit facility
24,534
30,588
Repayment of borrowings under revolving credit facility
(24,534
)
(30,588
)
Purchase of restricted shares of net2phone common stock
–
(3,558
)
Proceeds from exercise of stock options
–
172
Repurchases of Class B common stock
(11,395
)
(3,170
)
Net cash used in financing activities
(13,969
)
(6,615
)
Effect of exchange rate changes on cash, cash equivalents, and restricted cash and cash equivalents
(4,079
)
(3,182
)
Net (decrease) increase in cash, cash equivalents, and restricted cash and cash equivalents
(7,750
)
35,489
Cash, cash equivalents, and restricted cash and cash equivalents at beginning of period
255,456
198,823
Cash, cash equivalents, and restricted cash and cash equivalents at end of period
$
247,706
$
234,312
Supplemental Schedule of Non-Cash Financing Activities
Shares of the Company’s Class B common stock issued to an executive officer for bonus payment
$
1,824
$
–
Value of the Company’s Class B common stock exchanged for National Retail Solutions shares
$
–
$
6,254
*Reconciliation of Non-GAAP Financial Measures for the Second Quarter Fiscal 2025 and 2024
In addition to disclosing financial results that are determined in accordance with generally accepted accounting principles in the United States of America (GAAP), IDT also disclosed for 2Q25, 1Q25, and 2Q24, Adjusted EBITDA, and for 2Q25 and 2Q24, non-GAAP earnings per diluted share (Non-GAAP EPS). Adjusted EBITDA and Non-GAAP EPS are non-GAAP financial measures intended to provide useful information that supplements IDT’s or the relevant segment’s results in accordance with GAAP. The following explains these terms and their respective reconciliations to the most directly comparable GAAP measures
Generally, a non-GAAP measure is a numerical measure of a company’s performance, financial position, or cash flows that either excludes or includes amounts that are not normally excluded or included in the most directly comparable measure calculated and presented in accordance with GAAP.
IDT’s measure of Non-GAAP EPS is calculated by dividing non-GAAP net income by the diluted weighted-average shares. IDT’s measure of non-GAAP net income starts with net income attributable to IDT in accordance with GAAP and adds severance expense, stock-based compensation, and other operating expenses, and deducts other operating gains. These additions and subtractions are non-cash and/or non-routine items in the relevant fiscal 2025 and fiscal 2024 periods.
Management believes that IDT’s Adjusted EBITDA and Non-GAAP EPS are measures which provide useful information to both management and investors by excluding certain expenses and non-routine gains and losses that may not be indicative of IDT’s or the relevant segment’s core operating results. Management uses Adjusted EBITDA, among other measures, as a relevant indicator of core operational strengths in its financial and operational decision making. In addition, management uses Adjusted EBITDA and Non-GAAP EPS to evaluate operating performance in relation to IDT’s competitors. Disclosure of these financial measures may be useful to investors in evaluating performance and allows for greater transparency to the underlying supplemental information used by management in its financial and operational decision-making. In addition, IDT has historically reported similar financial measures and believes such measures are commonly used by readers of financial information in assessing performance, therefore the inclusion of comparative numbers provides consistency in financial reporting.
Management refers to Adjusted EBITDA, as well as the GAAP measures income (loss) from operations and net income, on a segment and/or consolidated level to facilitate internal and external comparisons to the segments’ and IDT’s historical operating results, in making operating decisions, for budget and planning purposes, and to form the basis upon which management is compensated.
While depreciation and amortization are considered operating costs under GAAP, these expenses primarily represent the non-cash current period allocation of costs associated with long-lived assets acquired or capitalized in prior periods. IDT’s Adjusted EBITDA, which is exclusive of depreciation and amortization, is a useful indicator of its current performance.
Severance expense is excluded from the calculation of Adjusted EBITDA and Non-GAAP EPS. Severance expense is reflective of decisions made by management in each period regarding the aspects of IDT’s and its segments’ businesses to be focused on in light of changing market realities and other factors. While there may be similar charges in other periods, the nature and magnitude of these charges can fluctuate markedly and do not reflect the performance of IDT’s core and continuing operations.
Other operating (expense) gain, net, which is a component of income (loss) from operations, is excluded from the calculation of Adjusted EBITDA and Non-GAAP EPS. Other operating (expense) gain, net includes, among other items, legal fees net of insurance claims related to Straight Path Communications Inc.’s stockholders’ class action and gain from the write-off of a contingent consideration liability. From time-to-time, IDT may have gains or incur costs related to non-routine legal, tax, and other matters, however, these various items generally do not occur each quarter. IDT believes the gain and losses from these non-routine matters are not components of IDT’s or the relevant segment’s core operating results.
Stock-based compensation recognized by IDT and other companies may not be comparable because of the variety of types of awards as well as the various valuation methodologies and subjective assumptions that are permitted under GAAP. Stock-based compensation is excluded from IDT’s calculation of Non-GAAP EPS because management believes this allows investors to make more meaningful comparisons of the operating results per share of IDT’s core business with the results of other companies. However, stock-based compensation will continue to be a significant expense for IDT for the foreseeable future and an important part of employees’ compensation that impacts their performance.
Adjusted EBITDA and Non-GAAP EPS should be considered in addition to, not as a substitute for, or superior to, income (loss) from operations, cash flow from operating activities, net income, basic and diluted earnings per share or other measures of liquidity and financial performance prepared in accordance with GAAP. In addition, IDT’s measurements of Adjusted EBITDA and Non-GAAP EPS may not be comparable to similarly titled measures reported by other companies.
Following are reconciliations of Adjusted EBITDA and Non-GAAP EPS to the most directly comparable GAAP measure, which are, (a) for Adjusted EBITDA, income (loss) from operations for IDT’s reportable segments and net income for IDT on a consolidated basis, and (b) for Non-GAAP EPS, diluted earnings per share.
IDT Corporation Reconciliation of Net Income to Adjusted EBITDA (unaudited) in millions. Figures may not foot or cross-foot due to rounding to millions
Total IDT Corporation
Traditional Communica-tions
net2phone
NRS
Fintech
Corporate
Three Months Ended January 31, 2025 (2Q25)
Net income attributable to IDT Corporation
$
20.3
Adjustments:
Net income attributable to noncontrolling interests
1.9
Net income
22.2
Provision for income taxes
7.7
Income before income taxes
29.9
Interest income, net
(1.4
)
Other income, net
(0.2
)
Income (loss) from operations
28.3
$
18.1
$
1.1
$
9.1
$
3.1
$
(3.1
)
Depreciation and amortization
5.2
1.9
1.6
1.0
0.8
–
Other operating expense, net
0.2
–
0.2
–
–
–
Severance
0.2
0.2
–
–
–
–
Adjusted EBITDA
$
34.0
$
20.2
$
2.9
$
10.1
$
3.9
$
(3.1
)
IDT Corporation Reconciliation of Net Income to Adjusted EBITDA (unaudited) in millions. Figures may not foot or cross-foot due to rounding to millions
Total IDT Corporation
Traditional Communica-tions
net2phone
NRS
Fintech
Corporate
Three Months Ended October 31, 2024 (1Q25)
Net income attributable to IDT Corporation
$
17.2
Adjustments:
Net income attributable to noncontrolling interests
1.2
Net income
18.5
Provision for income taxes
6.3
Income before income taxes
24.8
Interest income, net
(1.4
)
Other expense, net
0.3
Income (loss) from operations
23.6
$
15.7
$
1.0
$
6.6
$
3.2
$
(2.9
)
Depreciation and amortization
5.2
2.0
1.6
1.0
0.7
–
Severance
0.2
0.2
–
–
–
–
Adjusted EBITDA
$
29.1
$
17.8
$
2.5
$
7.6
$
4.0
$
(2.9
)
Total IDT Corporation
Traditional Communica-tions
net2phone
NRS
Fintech
Corporate
Three Months Ended January 31, 2024 (2Q24)
Net income attributable to IDT Corporation
$
14.4
Adjustments:
Net income attributable to noncontrolling interests
1.3
Net income
15.8
Provision for income taxes
4.0
Income before income taxes
19.7
Interest income, net
(1.2
)
Other income, net
(2.5
)
Income (loss) from operations
16.0
$
14.6
$
0.4
$
5.3
$
(0.7
)
$
(3.6
)
Depreciation and amortization
5.1
2.0
1.6
0.8
0.7
–
Severance
0.3
0.3
–
–
–
–
Other operating expense (gain), net
0.3
–
(0.1
)
–
–
0.4
Adjusted EBITDA
$
21.8
$
17.0
$
1.8
$
6.1
$
–
$
(3.2
)
IDT Corporation Reconciliation of Earnings per shareto Non-GAAP EPS (unaudited) in millions, except per share data. Figures may not foot due to rounding to millions.
2Q25
2Q24
Net income attributable to IDT Corporation
$
20.3
$
14.4
Adjustments (add) subtract:
Stock-based compensation
(0.9
)
(2.5
)
Severance expense
(0.2
)
(0.3
)
Other operating expense, net
(0.2
)
(0.3
)
Total adjustments
(1.3
)
(3.1
)
Income tax effect of total adjustments
(0.3
)
(0.6
)
1.0
2.5
Non-GAAP net income
$
21.3
$
16.9
Earnings per share:
Basic
$
0.81
$
0.57
Total adjustments
0.03
0.10
Non-GAAP – basic
$
0.84
$
0.67
Weighted-average number of shares used in calculation of basic earnings per share
25.2
25.2
Diluted
$
0.80
$
0.57
Total adjustments
0.04
0.10
Non-GAAP – diluted
$
0.84
$
0.67
Weighted-average number of shares used in calculation of diluted earnings per share
25.3
25.3
**Explanation of Key Performance Metrics
NRS’ recurring revenue is calculated by subtracting NRS’ revenue from POS terminal sales from its revenue in accordance with GAAP. NRS’ Monthly Average Recurring Revenue per Terminal is calculated by dividing NRS’ recurring revenue by the average number of active POS terminals during the period. The average number of active POS terminals is calculated by adding the beginning and ending number of active POS terminals during the period and dividing by two. NRS’ recurring revenue divided by the average number of active POS terminals is divided by three when the period is a fiscal quarter. Recurring revenue and Monthly Average Recurring Revenue per Terminal are useful for comparisons of NRS’ revenue and revenue per customer to prior periods and to competitors and others in the market, as well as for forecasting future revenue from the customer base.
The NRS ‘Rule of 40’ score is a metric used to evaluate the performance of SaaS providers. It postulates that a SaaS company’s growth rate when added to its free cash flow rate should equal or exceed 40 percent. For NRS, the ‘Rule of 40′ result for 2Q25 is computed by adding the growth rate of NRS’ recurring revenue for 2Q25 compared to 2Q24 to NRS’ Adjusted EBITDA less CapEx as a percentage of total NRS revenue for the twelve months ended January 31, 2025. The ‘Rule of 40’ is a common SaaS industry metric to assess a company’s balance between growth and profitability. A total above 40 is thought to indicate a healthy combination of expansion and financial stability, making it a useful tool for investors and management to gauge the potential for long-term success and make informed decisions about resource allocation and business strategy.
net2phone’s subscription revenue is calculated by subtracting net2phone’s equipment revenue and revenue generated by a legacy SIP trunking offering in Brazil from its revenue in accordance with GAAP. net2phone’s cloud communications and contact center offerings are priced on a per-seat basis, with customers paying based on the number of users in their organization. The number of seats served and subscription revenue trends and comparisons between periods are used in the analysis of net2phone’s revenues and direct cost of revenues and are strong indications of the top-line growth and performance of the business.
net2phone’s subscription revenue per seat is calculated by dividing net2phone’s subscription revenue, as defined in the preceding paragraph, by the average number of seats served during the period. The average number of seats served is calculated by adding the beginning and ending number of seats served and dividing by two. Subscription revenue per seat is the amount of revenue generated by each seat sold during the period. It provides a basis for pricing seat-based services, as well as for comparing performance in past periods and projecting future revenue, and for comparing the value of each seat served to competitors.
net2phone’s operating margin is calculated by dividing GAAP income from operations by GAAP revenue for the period indicated. Operating margin measures the percentage that each dollar of revenue contributes to profitability. Operating margin is useful for evaluating current period profitability relative to sales, for comparisons to prior period performance, for forecasting future income from operations levels based on projected levels of sales, and for comparing net2phone’s relative profitability to its competitors and peers.
net2phone’s Adjusted EBITDA margin is calculated by dividing net2phone’s Adjusted EBITDA, a Non-GAAP measure, by net2phone’s GAAP revenue for the comparable quarter or period. Adjusted EBITDA margin measures the percentage that each dollar of revenue contributes to profitability before interest, taxes, depreciation and amortization, and other adjustments as described in the Reconciliation of Non-GAAP Financial Measures. net2phone’s Adjusted EBITDA margin is useful for evaluating current period profitability relative to sales, for comparisons to prior period performance, for forecasting future Adjusted EBITDA levels based on projected levels of sales, and for comparing net2phone’s relative profitability to its competitors and peers.
BOSS Money’s Average Revenue per Transaction is calculated by dividing BOSS Money’s revenue in accordance with GAAP by the number of transactions during the period. Average Revenue per Transaction is useful for comparisons of BOSS Money’s revenue per transaction to prior periods and to competitors and others in the market, as well as for forecasting future revenue based on transaction trends.
# # #
NRSInsights’ February 2025 Retail Same-Store Sales Report
February same-store sales increased 3.5% year-over-year*
NEWARK, N.J., March 05, 2025 — NRSInsights, a provider of sales data and analytics drawn from retail transactions processed through the National Retail Solutions (NRS) point-of-sale (POS) platform, today announced comparative retail same-store sales results for February 2025.
As of February 28, 2025, the NRS retail network comprised approximately 34,800 active terminals nationwide, scanning purchases at approximately 30,300 independent retailers including convenience stores, bodegas, liquor stores, grocers, tobacco, and sundries sellers, predominantly serving urban consumers.
February Highlights*
(*Same-store sales, unit sales, transactions, and average price data refer to February 2025 and are compared to February 2024 unless otherwise noted. All comparisons are provided on a “per calendar day” basis to remove from consideration variability in the number of days per month or three month period.)
SALES
Same-store sales increased 3.5% year-over-year. In the previous month (January 2025), same-store sales had increased 4.7% year-over-year.
Same-store sales increased 6.1% compared to the previous month (January 2025). Same-store sales in January 2025 had decreased (7.5)% compared to the previous month (December 2024).
For the three months ended February 28 2025, same-store sales increased 2.7% compared to the corresponding three months a year ago.
UNITS SOLD
Units sold increased 3.0% year-over-year. In the previous month (January 2025), units sold had increased 2.3% year-over-year.
Units sold increased 5.0% compared to the previous month (January 2025). Units sold in January 2025 had decreased (3.1)% compared to the previous month (December 2024).
BASKETS (TRANSACTIONS) PER STORE
Baskets decreased (0.9)% year-over-year. In the previous month (January 2025), baskets had increased 1.1% year-over-year.
Baskets increased 4.6% compared to the previous month (January 2025). Baskets in January 2025 had decreased (5.3)% compared to the previous month (December 2024).
AVERAGE PRICES
A dollar-weighted average of prices for the top 500 items purchased increased 2.3% year-over-year, a lower rate of increase than the 2.9% year-over-year increase recorded in January 2025.
Retail Trade Comparative Data
The table below provides historical comparative data with the U.S. Commerce Department’s Advance Monthly Retail Trade same-store sales data excluding food service:
Over the past twelve months, the NRS network’s three-month moving average same-store sales have outpaced the US Commerce Department’s Advance Monthly Retail Trade data, excluding food services, by 1.0%, on average. However, in February, the Department’s three month rolling average increase exceeded the NRS network’s by 0.5%.
The NRSInsights data in the chart above have not been adjusted to reflect inflation, demographic distributions, seasonal buying patterns, item substitution, days per month, or other factors that may facilitate comparisons to other periods, to other same-store retail sales data, or to the U.S. Commerce Department’s retail data.
Commentary from Suzy Silliman (SVP, Data Strategy and Sales at NRS)
“Adjusting for leap year 2024, February 2025 dollar sales in same stores proved remarkably resilient, increasing meaningfully across the NRS network. Most DMAs (designated market areas) demonstrated overall sales growth including 23 of the top 25 markets.
“Smokeless Tobacco and Tequlia continue to enjoy strong year-over-year growth. Energy Beverages continues its multi-month recovery trend and Soft Drinks, Cigars, Rolling Papers, Prepared Cocktails and Vitamins & Supplements all had solid performance versus February 2024.
“The Gum category had its first year-over-year decrease in over a year, perhaps a sign that the category’s comeback has reached its plateau.
“Chocolate and Still Wine, two categories that typically show a seasonal spike for Valentine’s Day, both outperformed February 2024 on a leap-year adjusted basis, while their sister categories, Confectionary and Sparkling Wine/Champagne, suffered year-over-year declines.”
NRSInsights Reports
The NRSInsights monthly Same-Store Retail Sales Reports are intended to provide timely topline data reflective of sales at NRS’ network of independent, predominantly urban, retail stores.
Same-store data comparisons of February 2025 with February 2024 are derived from approximately 179 million transactions processed through the approximately 21,100 stores on the NRS network that scanned transactions in both months. Same-store data comparisons of February 2025 with January 2025 are derived from approximately 227 million transactions processed through approximately 29,300 stores.
Same-store data comparisons for the three months ended February 28, 2025 with the year-ago three months are derived from approximately 538 million scanned transactions processed through those stores that scanned transactions in both three-month periods.
NRS POS Platform
The NRS platform predominantly serves small-format, independent, retail stores nationwide including convenience stores, bodegas, liquor stores, grocers, tobacco, and sundries sellers. These independent retailers operate in all 50 states as well as the District of Columbia, and in 203 of the 210 designated market areas (DMAs) in the United States. During February 2025, NRS’ POS terminals processed $1.7 billion in sales (+14% year-over-year) across 113 million transactions (+9% year-over-year).
About National Retail Solutions (NRS):
National Retail Solutions operates the largest point-of-sale (POS) terminal-based platform and digital payment processing service for independent retailers nationwide. Retailers utilize NRS offerings to process transactions and effectively manage their businesses. Consumer packaged goods (CPG) suppliers, brokers, analytics firms, and advertisers access the terminal’s digital display network to reach these retailers’ predominantly urban, multi-cultural shopper base, and to harness transaction data-based learnings to identify growth opportunities and measure execution and returns on marketing investment. NRS is a subsidiary of IDT Corporation (NYSE: IDT).
All statements above that are not purely about historical facts, including, but not limited to, those in which we use the words “believe,” “anticipate,” “expect,” “plan,” “intend,” “estimate,” “target” and similar expressions, are forward-looking statements within the meaning of the Private Securities Litigation Reform Act of 1995. While these forward-looking statements represent our current judgment of what may happen in the future, actual results may differ materially from the results expressed or implied by these statements due to numerous important factors. Our filings with the SEC provide detailed information on such statements and risks, and should be consulted along with this release. To the extent permitted under applicable law, IDT assumes no obligation to update any forward-looking statements.
NRSInsights Contact: Suzy Silliman SVP, Data Strategy and Sales at NRS National Retail Solutions suzy.silliman@nrsplus.com
net2phone AI Agent manages sales, support, and administrative tasks across website, phone, and chat for enhanced customer experiences
Newark, NJ, Feb. 27, 2025 — net2phone, a leading provider of intelligent communications-as-a-service for businesses and contact centers, today introduced net2phone AI Agent, offering businesses of all sizes a highly scalable and customizable virtual agent to provide exceptional customer experiences across sales, support and administrative tasks.
“net2phone AI Agent leverages conversational AI to engage customers in helpful dialogues and to take approved actions on their behalf,” said Zali Ritholtz, net2phone’s COO. “From answering routine customer questions on order status and product availability to executing more complex tasks such as managing appointments or processing product returns, the net2phone AI Agent follows the company’s business rules and leverages external APIs to interact with your existing programs, software, and databases – assisting customers in much the same way an employee would but with greater speed, consistency and more cost effectively.”
net2phone AI Agent handles many aspects of routine customer interactions across the organization including:
Answering incoming calls and inquiries
Scheduling appointments and sending follow-up reminders
Providing customers with personalized account data including balances and order status
Greeting visitors on the website and guiding them in real-time
“Customers have strong channel preferences,” Ritholtz added. “net2phone AI Agent engages customers on the organization’s website, on the phone, or via chat – in whichever medium the customer is most comfortable. It is also fluent in multiple languages including English, Spanish and Portuguese, and is available around the clock.”
net2phone AI Agent helps organizations solve common sales, support and staffing challenges including:
Optimizing staffing levels in response to volatile demand
Recruiting, hiring and training staff for temporary or seasonal roles that do not provide long-term value
Repeatedly addressing similar and routine customer inquiries and requests
“net2phone AI Agent provides businesses of all sizes with a highly scalable and cost-effective solution to significant challenges organizations face as they work to enhance the experience of customer interactions,” said Jonah Fink, CEO of net2phone. “We invite businesses of all sizes to see how net2phone AI Agent can help your business grow more profitably.”
About net2phone:
net2phone’s innovative cloud-based, unified communications as a service, contact center as a service and SIP trunking solutions help businesses around the globe succeed through smarter conversations with enhanced intelligence and insights. net2phone’s commitment to delivering reliable and high-quality communications services has earned it a reputation as a leader in both innovation and growth. net2phone is a subsidiary of IDT Corporation (NYSE: IDT). To learn more, please visit net2phone.com or connect on LinkedIn.