IDT Corporation to Present at East Coast IDEAS Investor Conference
NEWARK, N.J., June 10, 2026 (GLOBE NEWSWIRE) — IDT Corporation (NYSE: IDT), a provider of fintech and communications solutions, will present at the East Coast IDEAS Investor Conference on Thursday, June 11, 2026 at the Westin Times Square in New York.
Marcelo Fischer, IDT’s Chief Financial Officer, and Bill Ulrey, VP Investor Relations, will provide an overview of the company’s operations, strategy, and financial results (through the third quarter of IDT’s fiscal year 2026) from 10:35 AM until 11:10 PM Eastern Time. Mr. Fischer will also host one-on-one investor meetings during the conference.
To attend or learn more about the IDEAS conferences, please contact Lacey Wesley at (817) 769 -2373 or lWesley@IDEASconferences.com.
All statements above that are not purely about historical facts, including, but not limited to, those in which we use the words “believe,” “anticipate,” “expect,” “plan,” “intend,” “estimate,” “target” and similar expressions, are forward-looking statements within the meaning of the Private Securities Litigation Reform Act of 1995. While these forward-looking statements represent our current judgment of what may happen in the future, actual results may differ materially from the results expressed or implied by these statements due to numerous important factors. Our filings with the SEC provide detailed information on such statements and risks, and should be consulted along with this release. To the extent permitted under applicable law, IDT assumes no obligation to update any forward-looking statements.
ABOUT IDT CORPORATION
IDT Corporation (NYSE: IDT) is a global provider of fintech and communications solutions through a portfolio of synergistic businesses: National Retail Solutions‘ (NRS) point-of-sale (POS) platform enables independent retailers to process transactions and operate more effectively while providing advertisers and marketers with reach into underserved consumer markets; BOSS Money facilitates innovative international remittances and fintech payments solutions; net2phone provides businesses with unified communications and AI-driven workflow solutions to enhance customer experience at scale; IDT Digital Payments and the BOSS Revolution calling service make sharing prepaid products and services and speaking with friends and family around the world convenient and reliable; and, IDT Global and IDT Express enable communications services to provision and manage international voice and SMS messaging.
CONTACT
Bill Ulrey IDT Investor Relations Phone: (973) 438-3838 E-mail: invest@idt.net
###
IDT Corporation Reports Third Quarter Fiscal Year 2026 Results
Record consolidated quarterly gross profit and gross profit margin
Income from operations at NRS, Fintech, and net2phone segments increased by 33%, 29% and 76%, respectively
FY 2026 guidance raised to $150-$152 million in Adjusted EBITDA*
NEWARK, N.J., June 03, 2026 (GLOBE NEWSWIRE) — IDT Corporation (NYSE: IDT), a global provider of fintech and communications solutions, today reported results for the third quarter of its fiscal year 2026, the three months ended April 30, 2026.
3Q26 CONSOLIDATED HIGHLIGHTS
Throughout this release, unless otherwise noted, results for the third quarter of fiscal year 2026 (3Q26) are compared to the third quarter of fiscal year 2025 (3Q25).
($ in millions except for per share figures)
Revenue
+5% to $315.7 from $302.0
Gross Profit
+9% to $122.5 from $112.0
Gross Profit Margin
+170 bps to 38.8% from 37.1%
Income from Operations
+12% to $29.8 from $26.6
GAAP EPS
+$0.01 to $0.87 from $0.86
Non-GAAP EPS*
+$0.04 to $0.94 from $0.90
Adjusted EBITDA
+13% to $37.5 from $33.1
*This release discloses certain Non-GAAP financial measures and Key Performance Metrics. Please see the explanations of those measures and metrics, the reasons for their inclusion, and reconciliations of non-GAAP measures to their closest GAAP measures, at the end of this release.
REMARKS BY SHMUEL JONAS, CEO
“IDT’s year-over-year revenue and earnings growth was again powered by the continued expansion and operating leverage of our three high-margin businesses, paired with another quarter of steady cash generation from our Traditional Communications segment.
“NRS recurring revenue increased 22% and revenue per terminal increased approximately 10% year-over-year driven by Merchant Services and SaaS Fees revenue. We expect both categories will continue driving growth in the coming quarters. After the quarter close, we acquired a controlling stake in OnCore Digital, a digital media brokerage.
“At BOSS Money, our digital channel revenue growth rate accelerated sequentially as we gained market share following implementation of the new federal remittance tax.
“net2phone continued its growth trajectory, helped by strong CCaaS results and ongoing U.S. and Mexico expansion. We are gaining traction with our AI offerings and expect they will become accretive growth drivers in fiscal year 2027. All net2phone offerings will also benefit from the recent release of Integrate by net2phone. Integrate is an integration layer that enables our clients to easily – through a straightforward, no-code interface – use our offerings with the tools they already work with every day including popular CRMs and ERPs.
“Across our business segments, we are integrating machine learning and AI tools to better understand and meet the expectations of our customers, develop and provide new features, enhance customer service, refine pricing strategies, accelerate product and feature delivery, create marketing campaigns, and streamline back-office operations, to name just a few. We expect that our AI efforts, in some cases, will serve as the basis for AI-based offerings to our customers.”
3Q26 RESULTS BY SEGMENT
National Retail Solutions (NRS)
($ in millions except recurring revenue per terminal.Numbers may not foot due to rounding.)
3Q26
2Q26
3Q25
3Q26-3Q25 (%, )
Terminals and payment processing accounts
Active POS terminals
39,300
38,900
35,600
+10
%
Payment processing accounts
29,200
28,100
25,500
+14
%
Recurring revenue*
Merchant Services & Other
$
25.8
$
24.0
$
19.7
+31
%
Advertising & Data
$
5.7
$
9.0
$
5.9
(3
)%
SaaS Fees
$
4.5
$
4.4
$
3.9
+17
%
Total recurring revenue
$
36.0
$
37.5
$
29.4
+22
%
POS Terminal Sales
$
2.0
$
1.9
$
1.7
+16
%
Total revenue
$
38.0
$
39.4
$
31.1
+22
%
Monthly average recurring revenue per terminal*
$
307
$
325
$
279
+10
%
Gross profit
$
34.3
$
36.3
$
28.4
+21
%
Gross profit margin
90.2
%
92.2
%
91.3
%
(110
) bps
SG&A
$
23.4
$
23.5
$
20.0
+17
%
Technology & development
$
2.7
$
2.5
$
2.3
+21
%
Income from operations
$
8.2
$
10.2
$
6.2
+33
%
Adjusted EBITDA
$
9.8
$
11.8
$
7.8
+25
%
CapEx
$
0.8
$
1.7
$
1.9
(59
)%
NRS Take-Aways
NRS added approximately 500 net active terminals and 1,100 net payment processing accounts during 3Q26. Net active terminal additions in 3Q26 reflect the impact of seasonal churn among specialized retailers serving the year-end holidays.
NRS’ ‘Rule of 40’* score was 50 in 3Q26, indicating a productive balance between growth and profitability.
Following the quarter close, IDT acquired OnCore Digital. Through the acquisition, NRS will integrate OnCore’s ad tech, demand, and publisher networks with its screen network and first-party transaction data into a more unified offering.
BOSS Money and Fintech Segment
($ in millions except for average revenue per transaction. Numbers may not foot due to rounding.)
3Q26
2Q26
3Q25
3Q26-3Q25 (%, )
BOSS Money transactions*
6.9
6.4
6.0
+15
%
Digital channel
6.0
5.5
5.0
+20
%
Retail channel
0.9
1.0
1.0
(14
)%
Fintech segment revenue
BOSS Money
$
39.7
$
36.3
$
34.4
+15
%
Digital channel
$
31.0
$
26.8
$
24.5
+27
%
Retail channel
$
8.6
$
9.5
$
9.9
(13
)%
Other
$
5.3
$
4.9
$
4.2
+27
%
Total Fintech segment revenue
$
45.0
$
41.2
$
38.6
+17
%
Average BOSS Money revenue per transaction*
$
5.76
$
5.63
$
5.74
+0
%
Fintech segment
Gross profit
$
28.3
$
25.0
$
22.6
+25
%
Gross profit margin
62.8
%
60.6
%
58.5
%
+430
bps
SG&A
$
20.2
$
18.2
$
16.0
+26
%
Technology & development
$
2.5
$
2.7
$
2.2
+15
%
Income from operations
$
5.6
$
4.1
$
4.3
+29
%
Adjusted EBITDA
$
6.6
$
5.6
$
5.1
+30
%
CapEx
$
1.0
$
1.1
$
0.8
+20
%
BOSS Money and Fintech Take-Aways:
BOSS Money digital channel send volume*– the amount of principal transferred by BOSS Money customers using the BOSS Money and BOSS Revolution apps – increased by 40% in 3Q26 compared to 3Q25, reflecting increases in both transaction volume and average dollars sent per transaction.
The Fintech segment’s year-over-year increases in income from operations and Adjusted EBITDA were driven by BOSS Money’s digital transaction growth, increased revenue and gross margin per digital transaction, and improved economics from other, smaller, businesses within the Fintech segment.
net2phone
($ in millions.Numbers may not foot due to rounding.)
3Q26
2Q26
3Q25
3Q26-3Q25 (%, )
Seats
441
435
415
+6
%
Revenue
Subscription revenue*
$
24.0
$
23.4
$
21.5
+12
%
Other
$
0.4
$
0.4
$
0.5
(14
)%
Total revenue
$
24.4
$
23.9
$
22.0
+11
%
Gross profit
$
19.6
$
19.3
$
17.5
+12
%
Gross profit margin
80.6
%
80.7
%
79.6
%
+130
bps
SG&A
$
14.1
$
13.9
$
13.0
+9
%
Technology & development
$
3.1
$
3.1
$
2.9
+5
%
Income from operations
$
2.4
$
2.2
$
1.4
+76
%
Adjusted EBITDA
$
4.1
$
3.9
$
3.2
+30
%
CapEx
$
1.8
$
1.7
$
1.4
+30
%
net2phone Take-Aways:
Subscription revenue increased faster than seats served, reflecting an increase in CCaaS seats, which generate higher revenue per seat than our UCaaS offerings, augmented by the positive FX impact of strengthening local currencies versus the U.S. dollar in certain Latin American markets.
net2phone generated substantial year-over-year increases in income from operations and Adjusted EBITDA during 3Q26, benefitting from customer acquisition cost discipline and continued operating leverage.
Traditional Communications
($ in millions. Numbers may not foot due to rounding.)
3Q26
2Q26
3Q25
3Q26-3Q25 (%, )
Revenue
IDT Digital Payments
$
103.9
$
104.4
$
102.6
+1
%
IDT Global
$
55.6
$
60.2
$
50.0
+11
%
BOSS Revolution
$
43.4
$
45.7
$
51.7
(16
)%
Other revenue
$
5.5
$
5.8
$
5.8
(6
)%
Total revenue
$
208.3
$
216.1
$
210.2
(1
)%
Gross profit
$
40.3
$
40.7
$
43.4
(7
)%
Gross profit margin
19.4
%
18.9
%
20.7
%
(130
) bps
SG&A
$
17.9
$
20.3
$
20.5
(13
)%
Technology & development
$
5.6
$
5.8
$
5.4
+4
%
Income from operations
$
16.7
$
14.3
$
17.3
(4
)%
Adjusted EBITDA
$
19.7
$
18.8
$
19.6
+1
%
CapEx
$
1.5
$
1.6
$
1.3
+17
%
Traditional Communications Take-Away:
IDT continues to minimize Traditional Communications’ overhead and improve its cost structure. This effort resulted in a $2.6 million decrease in segment SG&A in 3Q26 compared to the year ago quarter, particularly in employee compensation and legal expense.
OTHER FINANCIAL RESULTS
Consolidated results for all periods presented include corporate overhead. Corporate G&A expense increased 22% to $3.2 million in 3Q26 from $2.7 million in 3Q25, primarily as a result of increased stock-based compensation.
As of April 30, 2026, IDT held $251.4 million in cash, cash equivalents, and current debt and equity securities, exclusive of restricted cash. Also as of April 30, 2026, current assets totaled $592.7 million and current liabilities totaled $308.0 million. IDT had no outstanding debt at quarter end.
Net cash provided by operating activities in 3Q26 was $18.5 million compared to $75.7 million in 3Q25. Exclusive of changes in customer funded deposits at IDT’s Fintech segment businesses, adjusted net cash provided by operating activities* in 3Q26 was $16.0 million compared to $66.1 million in 3Q25. The decline in operating cash generation is due entirely to working capital timing, as 3Q26 ended on a Thursday which, along with Friday, is typically when cash levels are lowest because of prepaid weekend funding requirements for the BOSS Money and IDT Digital Payments businesses.
Capital expenditures decreased to $5.1 million in 3Q26 from $5.4 million in 3Q25.
During 3Q26, IDT repurchased approximately 84,000 shares of its Class B common stock for $4.0 million. For the nine months ended April 30, 2026, IDT repurchased approximately 391,000 shares for $19.0 million.
FY 2026 FINANCIAL OUTLOOK
IDT is increasing its previous FY 2026 guidance for consolidated Adjusted EBITDA from $147-$149 million to $150-$152 million. At the midpoint, the updated guidance represents an increase of 15% from FY 2025 Adjusted EBITDA of $131.7 million.
Reconciliations of Adjusted EBITDA to net income and income from operations for all periods presented are included in the Non-GAAP reconciliations provided at the end of this release.
DIVIDEND
IDT’s Board of Directors has declared a quarterly cash dividend of $0.07 per share of IDT Class A and Class B Common stock payable on June 18, 2026 to stockholders of record as of June 9, 2026.
IDT EARNINGS ANNOUNCEMENT INFORMATION
This release is available for download in the “Investors & Media” section of the IDT Corporation website (https://www.idt.net/investors-and-media) and has been filed on a current report (Form 8-K) with the SEC.
IDT will host an earnings conference call beginning at 5:30 PM Eastern this evening with management’s discussion of results followed by Q&A with investors. To listen to the call and participate in the Q&A, dial 1-877-545-0523 (toll-free from the US) or 1-973-528-0016 (international) and provide the following access code: 181062.
A replay of the conference call will be available approximately three hours after the call concludes through June 17th, 2026. To access the call replay, dial 1-877-481-4010 (toll-free from the US) or 1-919-882-2331 (international) and provide this replay passcode: 54085. The replay will also be accessible via streaming audio at the IDT investor relations website.
ABOUT IDT CORPORATION
IDT Corporation (NYSE: IDT) is a global provider of fintech and communications solutions through a portfolio of synergistic businesses: National Retail Solutions‘ (NRS) point-of-sale (POS) platform enables independent retailers to process transactions and operate more effectively while providing advertisers and marketers with reach into underserved consumer markets; BOSS Money facilitates innovative international remittances and fintech payments solutions; net2phone provides businesses with unified communications and AI-driven workflow solutions to enhance customer experience at scale; IDT Digital Payments and the BOSS Revolution calling service make sharing prepaid products and services and speaking with friends and family around the world convenient and reliable; and, IDT Global and IDT Express enable communications services to provision and manage international voice and SMS messaging.
All statements above that are not purely about historical facts, including, but not limited to, those in which we use the words “believe,” “anticipate,” “expect,” “plan,” “intend,” “estimate,” “target“ and similar expressions, are forward-looking statements within the meaning of the Private Securities Litigation Reform Act of 1995. While these forward-looking statements represent our current judgment of what may happen in the future, actual results may differ materially from the results expressed or implied by these statements due to numerous important factors. Our filings with the SEC provide detailed information on such statements and risks and should be consulted along with this release. To the extent permitted under applicable law, IDT assumes no obligation to update any forward-looking statements.
CONTACT
IDT Corporation Investor Relations Bill Ulrey william.ulrey@idt.net 973-438-3838
IDT CORPORATION
CONDENSED CONSOLIDATED BALANCE SHEETS
April 30, 2026
July 31, 2025
(in thousands, except per share data)
(Unaudited)
Assets
Current assets:
Cash and cash equivalents
$
214,957
$
226,505
Restricted cash and cash equivalents
128,385
115,327
Debt securities
26,557
21,649
Equity investments
9,913
5,637
Trade accounts receivable, net of allowance for credit losses of $8,039 at April 30, 2026 and $9,097 at July 31, 2025
41,750
44,932
Settlement assets, net of reserve of $1,816 at April 30, 2026 and $1,367 at July 31, 2025
35,033
28,014
Disbursement prefunding
96,396
37,097
Prepaid expenses
8,889
12,440
Other current assets
30,829
28,702
Total current assets
592,709
520,303
Property, plant, and equipment, net
41,010
38,869
Goodwill
26,600
26,488
Other intangibles, net
4,177
5,056
Equity investments
5,879
6,658
Operating lease right-of-use assets
1,247
1,878
Deferred income tax assets, net
18,200
18,790
Other assets
8,207
8,161
Total assets
$
698,029
$
626,203
Liabilities, redeemable noncontrolling interest, and stockholders’ equity
Current liabilities:
Trade accounts payable
$
15,229
$
19,435
Accrued expenses
90,548
97,295
Deferred revenue
26,207
27,726
Customer fund deposits
130,081
114,708
Settlement liabilities
17,125
13,922
Other current liabilities
28,846
19,910
Total current liabilities
308,036
292,996
Operating lease liabilities
621
1,103
Other liabilities
926
1,688
Total liabilities
309,583
295,787
Commitments and contingencies
Redeemable noncontrolling interest
12,022
11,459
Equity:
Preferred stock, $.01 par value; authorized shares – 10,000; no shares issued
–
–
Class A common stock, $.01 par value; authorized shares – 35,000; 3,272 shares issued and 1,574 shares outstanding at April 30, 2026 and July 31, 2025
33
33
Class B common stock, $.01 par value; authorized shares – 200,000; 28,564 and 28,528 shares issued and 23,290 and 23,656 shares outstanding at April 30, 2026 and July 31, 2025, respectively
285
285
Additional paid-in capital
317,474
308,111
Treasury stock, at cost, consisting of 1,698 and 1,698 shares of Class A common stock and 5,274 and 4,872 shares of Class B common stock at April 30, 2026 and July 31, 2025, respectively
(163,380
)
(143,853
)
Accumulated other comprehensive loss
(13,809
)
(16,569
)
Retained earnings
217,284
157,124
Total IDT Corporation stockholders’ equity
357,887
305,131
Noncontrolling interests
18,537
13,826
Total equity
376,424
318,957
Total liabilities, redeemable noncontrolling interest, and equity
$
698,029
$
626,203
IDT CORPORATION
CONDENSED CONSOLIDATED STATEMENTS OF INCOME (Unaudited)
Three Months Ended April 30,
Nine Months Ended April 30,
(in thousands, except per share amounts)
2026
2025
2026
2025
Revenues
$
315,713
$
301,985
$
958,981
$
914,901
Direct cost of revenues
193,210
190,023
597,022
583,201
Gross profit
122,503
111,962
361,959
331,700
Operating expenses:
Selling, general, and administrative
78,843
72,267
231,696
214,039
Technology and development
13,944
12,744
41,698
38,115
Severance
107
190
538
600
Other operating (income) expense, net
(180
)
175
67
403
Total operating expenses
92,714
85,376
273,999
253,157
Income from operations
29,789
26,586
87,960
78,543
Interest income
1,561
1,566
4,909
4,347
Other income, net
904
2,608
623
2,533
Income before income taxes
32,254
30,760
93,492
85,423
Provision for income taxes
(8,507
)
(7,798
)
(22,825
)
(21,766
)
Net income
23,747
22,962
70,667
63,657
Net income attributable to noncontrolling interests
(2,134
)
(1,270
)
(5,744
)
(4,448
)
Net income attributable to IDT Corporation
$
21,613
$
21,692
$
64,923
$
59,209
Earnings per share attributable to IDT Corporation common stockholders:
Basic
$
0.87
$
0.86
$
2.59
$
2.35
Diluted
$
0.87
$
0.86
$
2.59
$
2.34
Weighted-average number of shares used in calculation of earnings per share:
Basic
24,893
25,165
25,041
25,177
Diluted
24,915
25,249
25,054
25,312
(i) Stock-based compensation included in total operating expenses
$
2,420
$
946
$
8,783
$
2,720
IDT CORPORATION
CONDENSED CONSOLIDATED STATEMENTS OF CASH FLOWS (Unaudited)
Nine Months Ended April 30,
(in thousands)
2026
2025
Operating activities:
Net income
$
70,667
$
63,657
Adjustments to reconcile net income to net cash from operating activities:
Depreciation and amortization
16,054
15,702
Deferred income taxes
561
18,902
Provision for credit losses and reserve for settlement assets
3,466
4,465
Stock-based compensation expense
8,783
2,720
Other
1,316
1,735
Change in operating assets and liabilities:
Trade accounts receivable
934
(4,206
)
Prepaid expenses, other current assets, and other assets
4,278
7,424
Settlement assets and disbursement prefunding
(66,838
)
(16,799
)
Trade accounts payable, accrued expenses, settlement liabilities, other current liabilities, and other liabilities
(2,374
)
(19,486
)
Customer fund deposits
12,101
25,327
Deferred revenue
(2,285
)
(3,382
)
Net cash provided by operating activities
46,663
96,059
Investing activities:
Capital expenditures
(17,070
)
(15,507
)
Purchase of equity investments
(1,650
)
–
Purchase of convertible preferred stock in equity method investment
–
(926
)
Purchases of debt securities and equity securities
(42,981
)
(29,083
)
Proceeds from maturities and sales of debt and equity securities
34,607
35,005
Net cash used in investing activities
(27,094
)
(10,511
)
Financing activities:
Dividends paid
(4,763
)
(4,036
)
Distributions to noncontrolling interests
(90
)
(100
)
Proceeds from borrowings under revolving credit facility
21,421
24,551
Repayments on borrowings under revolving credit facility
(21,421
)
(24,551
)
Proceeds from borrowings
185
–
Repayments of borrowings
(100
)
–
Proceeds from exercise of stock options
200
–
Repurchases of Class B common stock
(19,526
)
(17,773
)
Net cash used in financing activities
(24,094
)
(21,909
)
Effect of exchange rate changes on cash, cash equivalents and restricted cash and cash equivalents
6,035
3,982
Net increase in cash, cash equivalents, and restricted cash and cash equivalents
1,510
67,621
Cash, cash equivalents and restricted cash and cash equivalents, beginning of period
341,832
255,456
Cash, cash equivalents and restricted cash and cash equivalents, end of period
$
343,342
$
323,077
Supplemental cash flow information
Cash paid during the period for:
Income taxes paid
$
14,151
$
–
Non-Cash Financing Activities
Shares of the Company’s Class B common stock issued to executive officer for bonus
$
–
$
1,824
Value of the Company’s DSUs exchanged for National Retail Solutions shares
$
3,547
$
442
Reconciliation of Non-GAAP Financial Measures for the Third Quarter Fiscal 2026 and 2025
In addition to disclosing financial results that are determined in accordance with generally accepted accounting principles in the United States of America (GAAP), IDT also disclosed (a) Adjusted EBITDA for 3Q26, 2Q26, and 3Q25, among other quarters (b) non-GAAP earnings per diluted share (Non-GAAP EPS) for 3Q26 and 3Q25 (c) NRS’ ‘Rule of 40’ score for 3Q26 and (d) non-GAAP adjusted net cash provided by or used in operating activities for 3Q26 and 3Q25. These are non-GAAP financial measures intended to provide useful information that supplements IDT’s or the respective segment’s results in accordance with GAAP. The following explains these terms and their respective reconciliations to the most directly comparable GAAP measures.
Generally, a non-GAAP measure is a numerical measure of a company’s performance, financial position, or cash flows that either excludes or includes amounts that are not normally excluded or included in the most directly comparable measure calculated and presented in accordance with GAAP.
IDT’s measure of Adjusted EBITDA starts with net income from operations in accordance with GAAP and adds depreciation and amortization, severance expense, stock-based compensation, and other operating expenses, and deducts other operating income.
IDT’s measure of Non-GAAP EPS is calculated by dividing non-GAAP net income by the diluted weighted-average shares. IDT’s measure of non-GAAP net income starts with net income attributable to IDT in accordance with GAAP and adds severance expense, stock-based compensation, and other operating expenses, and deducts other operating income. These additions and subtractions are non-cash and/or non-routine items in the relevant fiscal 2026 and fiscal 2025 periods.
Management believes that IDT’s Adjusted EBITDA and Non-GAAP EPS are measures which provide useful information to both management and investors by excluding certain expenses and non-routine gains and losses that may not be indicative of IDT’s or the respective segment’s core operating results. Management uses Adjusted EBITDA, among other measures, as a relevant indicator of core operational strengths in its financial and operational decision making. In addition, management uses Adjusted EBITDA and Non-GAAP EPS to evaluate operating performance in relation to IDT’s competitors. Disclosure of these financial measures may be useful to investors in evaluating performance and allow for greater transparency of the underlying supplemental information used by management in its financial and operational decision-making. In addition, IDT has historically reported similar financial measures and believes such measures are commonly used by readers of financial information in assessing performance, therefore the inclusion of comparative numbers provides consistency in financial reporting.
Management refers to Adjusted EBITDA, as well as the GAAP measures income (loss) from operations and net income, on a segment and/or consolidated level to facilitate internal and external comparisons to the segments’ and IDT’s historical operating results, in making operating decisions, for budget and planning purposes, and to form the basis upon which management is compensated.
While depreciation and amortization are considered operating costs under GAAP, these expenses primarily represent the non-cash current period allocation of costs associated with long-lived assets acquired or capitalized in prior periods. IDT’s Adjusted EBITDA, which is exclusive of depreciation and amortization, is a useful indicator of its current performance.
Severance expense is excluded from the calculation of Adjusted EBITDA and Non-GAAP EPS. Severance expense is reflective of decisions made by management in each period regarding the aspects of IDT’s and its segments’ businesses to be focused on in light of changing market realities and other factors. While there may be similar charges in other periods, the nature and magnitude of these charges can fluctuate markedly and do not reflect the performance of IDT’s core and continuing operations.
Other operating income (expense), net, which is a component of income (loss) from operations, is excluded from the calculation of Adjusted EBITDA and Non-GAAP EPS. Other operating expense, net primarily includes legal fees net of insurance claims related to Straight Path Communications Inc.’s stockholders’ class action, legal settlements, and gains from the write-off of contingent consideration liabilities. From time-to-time, IDT may have gains or incur costs related to non-routine legal, tax, and other matters, however, these various items generally do not occur each quarter. IDT believes the gains and losses from these non-routine matters are not components of IDT’s or the respective segment’s core operating results.
Stock-based compensation recognized by IDT and other companies may not be comparable because of the variety of types of awards as well as the various valuation methodologies and subjective assumptions that are permitted under GAAP. Stock-based compensation is excluded from IDT’s calculation of Adjusted EBITDA and Non-GAAP EPS because management believes this allows investors to make more meaningful comparisons of the operating results per share of IDT’s core business with the results of other companies. Stock-based compensation continues to be a significant expense for IDT and an important part of employees’ compensation that impacts their performance.
Adjusted EBITDA and Non-GAAP EPS should be considered in addition to, not as a substitute for, or superior to, income (loss) from operations, cash flow from operating activities, net income, basic and diluted earnings per share or other measures of liquidity and financial performance prepared in accordance with GAAP. In addition, IDT’s measurements of Adjusted EBITDA and Non-GAAP EPS may not be comparable to similarly titled measures reported by other companies.
The ‘Rule of 40’ score is a metric used to evaluate the performance of SaaS and other subscription-based providers. It postulates that a SaaS provider’s revenue growth rate plus its EBITDA margin should equal or exceed 40 percent. The ‘Rule of 40’ is typically used to assess a company’s balance between growth and profitability. A total of over 40 is thought to indicate a healthy combination of expansion and financial stability, making it a useful tool for management and investors to gauge the potential for long-term success and make informed decisions about resource allocation and business strategy.
NRS’ ‘Rule of 40′ score is computed by adding (a) the growth rate of NRS’ recurring revenue for the relevant period compared to the corresponding year ago period to (b) NRS’ Adjusted EBITDA margin for the twelve-month period through the end of the current period. NRS’ recurring revenue is calculated by subtracting NRS’ revenue from POS terminal sales from its total GAAP revenue. Adjusted EBITDA is a non-GAAP measure as discussed above. Adjusted EBITDA margin is calculated by dividing Adjusted EBITDA by GAAP revenue for the relevant period.
IDT’s Non-GAAP adjusted measure of net cash provided by operating activities is calculated by excluding the impact of changes in customer funds deposits held from net cash provided by operating activities. Customer funds deposits represent, for the most part, funds loaded by customers of the various prepaid debit card programs issued under IDT’s wholly-owned bank in Gibraltar. As such, these funds are held for customers and are not available for use by the Company. This adjusted measure of net cash provided by operating activities provides a more meaningful measure of the cash generated by our core business operations, making it a more useful tool for management and investors to evaluate the cash generation of our business operations, and to compare IDT’s cash generation with companies that do not have, or have different levels of, customer deposits. Customer deposits are, by regulation, not available to fund IDT’s operating activities.
Following are reconciliations of Adjusted EBITDA and Non-GAAP EPS to the most directly comparable GAAP measure, which are, (a) for Adjusted EBITDA, (i) income (loss) from operations for IDT’s reportable segments and corporate and (ii) net income for IDT on a consolidated basis, and (b) for Non-GAAP EPS, diluted earnings per share. Also following is NRS’ ‘Rule of 40′ score computation including the reconciliation of NRS’ Adjusted EBITDA to the most directly comparable GAAP measure, NRS’ income from operations, and IDT’s Non-GAAP adjusted measure of net cash provided by operating activities reconciled to GAAP net cash provided by operating activities.
IDT Corporation Reconciliation of Net Income to Adjusted EBITDA for the three months ended 3Q26, 2Q26, and 3Q25 (unaudited) in millions. Figures may not foot or cross-foot due to rounding
Total IDT Corporation
Traditional Comm.
net2phone
NRS
Fintech
Corporate
3Q26
Net income attributable to IDT Corporation
$
21.6
Adjustments:
Net income attributable to noncontrolling interests
(2.1
)
Net income
$
23.7
Provision for income taxes
(8.5
)
Income before income taxes
$
32.3
Interest income, net
1.6
Other expense, net
0.9
Income (loss) from operations
$
29.8
$
16.7
$
2.4
$
8.2
$
5.6
$
(3.0
)
Depreciation and amortization
5.4
1.8
1.7
1.2
0.7
0.0
Stock-based compensation
2.4
1.2
–
0.4
0.4
0.4
Other operating income, net
(0.2
)
0.0
0.0
0.0
–
(0.2
)
Severance expense
0.1
0.1
0.0
0.0
0.0
–
Adjusted EBITDA
$
37.5
$
19.7
$
4.1
$
9.8
$
6.6
$
(2.8
)
Total IDT Corporation
Traditional Comm.
net2phone
NRS
Fintech
Corporate
2Q26
Net income attributable to IDT Corporation
$
20.9
Adjustments:
Net income attributable to noncontrolling interests
(1.9
)
Net income
$
22.8
Provision for income taxes
(6.2
)
Income before income taxes
$
29.1
Interest income, net
1.6
Other expense, net
0.2
Income (loss) from operations
$
27.2
$
14.3
$
2.2
$
10.2
$
4.1
$
(3.5
)
Depreciation and amortization
5.4
1.8
1.7
1.2
0.8
–
Stock-based compensation
4.3
2.4
–
0.4
0.8
0.7
Other operating expense, net
0.8
0.2
–
–
–
0.7
Severance expense
0.2
0.1
0.1
–
–
–
Adjusted EBITDA
$
38.0
$
18.8
$
3.9
$
11.8
$
5.6
$
(2.1
)
Total IDT Corporation
Traditional Comm.
net2phone
NRS
Fintech
Corporate
3Q25
Net income attributable to IDT Corporation
$
21.7
Adjustments:
Net income attributable to noncontrolling interests
(1.3
)
Net income
$
23.0
Provision for income taxes
(7.8
)
Income before income taxes
$
30.8
Interest income, net
1.6
Other expense, net
2.6
Income (loss) from operations
$
26.6
$
17.3
$
1.4
$
6.2
$
4.3
$
(2.6
)
Depreciation and amortization
5.2
1.9
1.6
1.0
0.7
–
Stock-based compensation
0.9
0.3
–
0.6
0.1
–
Other operating expense, net
0.2
–
0.2
–
–
–
Severance expense
0.2
0.2
–
–
–
$
–
Adjusted EBITDA
$
33.1
$
19.6
$
3.2
$
7.8
$
5.1
$
(2.6
)
IDT Corporation Reconciliation of Earnings Per Share (EPS) to Non-GAAP EPS for 3Q26 and 3Q25 (unaudited) in millions, except for per share data. Figures may not foot due to rounding
3Q26
3Q25
Net income attributable to IDT Corporation
$
21.6
$
21.7
Adjustments (add) subtract:
Stock-based compensation
(2.4
)
(0.9
)
Severance expense
(0.1
)
(0.2
)
Other operating income (expense), net
0.2
(0.2
)
Total adjustments
(2.3
)
(1.3
)
Income tax effect of total adjustments
(0.6
)
(0.3
)
1.7
1.0
Non-GAAP net income
$
23.3
$
22.7
Earnings per share:
Basic
$
0.87
$
0.86
Total adjustments
0.07
0.04
Non-GAAP – basic
$
0.94
$
0.90
Weighted-average number of shares used in calculation of basic earnings per share
24.9
25.2
Diluted
$
0.87
$
0.86
Total adjustments
0.07
0.04
Non-GAAP – diluted
$
0.94
$
0.90
Weighted-average number of shares used in calculation of diluted earnings per share
24.9
25.2
IDT Corporation NRS‘‘Rule of 40‘ Score For 3Q26 (unaudited) in millions. Figures may not foot due to rounding
Trailing twelve months (TTM)
4Q25
1Q26
2Q26
3Q26
3Q26
Reconciliation of NRS’ Income from Operations to Adjusted EBITDA
Income from operations
$
5.8
$
8.9
$
10.2
$
8.2
$
33.2
Depreciation and amortization
1.1
1.1
1.2
1.2
4.6
Stock-based compensation
0.2
0.2
0.4
0.4
1.2
Other operating expense, net
2.4
0.0
0.0
0.0
2.4
Severance expense
0.0
0.0
0.0
0.0
0.1
Adjusted EBITDA
$
9.5
$
10.3
$
11.8
$
9.8
$
41.4
NRS’ ‘Rule of 40’ Score
3Q26
3Q25
NRS recurring revenue
$
36.0
$
29.4
NRS other revenue
2.0
1.7
NRS total revenue
$
38.0
$
31.1
NRS recurring revenue growth rate
22
%
NRS TTM Adjusted EBITDA (from above)
$
41.4
NRS TTM total revenue
$
148.7
NRS TTM Adjusted EBITDA margin
28
%
‘Rule of 40’ score
50
%
IDT Corporation
Adjusted net cash provided by operating activities for 3Q26 and 3Q25 (unaudited) in millions. Figures may not foot due to rounding
(in millions)
Three months ended April 30, 2026
3Q26
3Q25
Net cash provided by operating activities (GAAP)
$
18.5
$
75.7
Changes in customer deposits
$
2.5
$
9.6
Adjusted net cash provided by operating activities
$
16.0
$
66.1
Explanation of Key Performance Metrics
net2phone Subscription Revenue is calculated by subtracting net2phone’s equipment revenue and revenue generated by a legacy SIP trunking offering in Brazil from its revenue in accordance with GAAP. net2phone’s cloud communications and contact center offerings are priced on a per-seat basis, with customers paying based on the number of users in their organization. The number of seats served and subscription revenue trends and comparisons between periods are used in the analysis of net2phone’s revenues and direct cost of revenues and are strong indications of the top-line growth and performance of the business.
NRS‘ Monthly Average Recurring Revenue perTerminal is calculated by dividing NRS’ recurring revenue as defined in the Reconciliation of Non-GAAP Financial Measures by the average number of active POS terminals during the period. The average number of active POS terminals is calculated by adding the beginning and ending number of active POS terminals during the period and dividing by two. NRS’ recurring revenue divided by the average number of active POS terminals is divided by three when the period is a fiscal quarter. Recurring Revenue and Monthly Average Recurring Revenue per Terminal are useful for comparisons of NRS’ revenue and revenue per customer to prior periods and to competitors and others in the market, as well as for forecasting future revenue from the customer base.
BOSS Money Transactions are a nonfinancial metric that measures customer usage during a reporting period. Average BOSS Money Revenue per Transaction measures the revenue productivity of BOSS Money’s remittance business. It is calculated by dividing BOSS Money revenue during the period by the number of transactions. Average BOSS Money Revenue per Transaction is a key metric for evaluating the productivity and operational performance of the business. BOSS Money‘s Digital Send Volume is the aggregate amount of principal remitted by BOSS Money’s digital customers – those using the BOSS Money and BOSS Revolution apps to originate remittances. Digital Send Volume is a key metric for evaluating the operational performance of the digital channel of the remittance business, and for comparing the performance of BOSS Money’s digital channel to competitors in the remittance business as well as to performance to other temporal periods.
# # #
NRSInsights’ May 2026 Retail Same-Store Sales Report
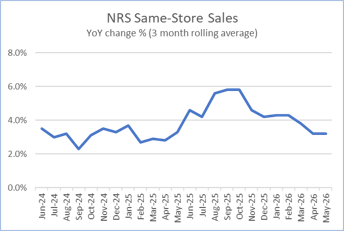
May same-store sales increased 4.0% year-over-year
The average price paid for the top 500 items in May increased 2.3% year-over-year
NEWARK, N.J., June 03, 2026 (GLOBE NEWSWIRE) — NRSInsights, a provider of sales data and analytics drawn from retail transactions processed through the National Retail Solutions (NRS) point-of-sale (POS) platform, today announced comparative retail same-store sales results for May 2026.
As of May 31, 2026, the NRS retail network comprised approximately 39,600 active terminals nationwide, scanning purchases at approximately 34,300 independent retailers, including convenience stores, bodegas, liquor stores, grocers, and tobacco and sundries sellers, predominantly serving urban consumers.
May Highlights
(Same-store sales, unit sales, transactions, and average price data refer to May 2026 and are compared to May 2025 unless otherwise noted. All comparisons are provided on a “per calendar day” basis to remove from consideration variability in the number of days per month or three-month period.)
SALES
Same-store sales increased 4.0% year-over-year. In the previous month (April 2026), same-store sales increased 3.9% year-over-year.
Same-store sales increased 3.9% compared to the previous month (April 2026). Same-store sales in April 2026 increased 1.7% compared to the previous month (March 2026).
For the three months ended May 31, 2026, same-store sales increased 3.2% compared to the corresponding three months a year ago.
UNITS SOLD
Units sold increased 0.5% year-over-year, the same rate of increase as the previous month (April 2026).
Units sold increased 1.8% compared to the previous month (April 2026). Units sold in April 2026 increased 1.3% compared to the previous month (March 2026).
BASKETS (TRANSACTIONS) PER STORE
Baskets decreased 0.5% year-over-year. In the previous month (April 2026), baskets decreased 0.3% year-over-year.
Baskets increased 2.7% compared to the previous month (April 2026). Baskets in April 2026 increased 2.9% compared to the previous month (March 2026).
AVERAGE PRICES
A dollar-weighted average of prices for the top 500 items purchased in May 2026 increased 2.3% year-over-year, compared to the 2.2% year-over-year increase in April 2026.
Commentary from Brandon Thurber (VP, Data Sales & Client Success at NRS)
“May delivered steady same-store growth, with dollar sales up 4.0% year over year. While baskets were down slightly versus last year, they have been increasing month over month as we move into the summer season, a pattern we typically expect this time of year.
“Warm weather looks to have sparked demand across hydration and refreshment categories, with frozen novelty, sport drinks, sparkling water, and energy beverages all posting solid sequential and year-over-year gains.
“Cigarettes, prepared cocktails, and nicotine pouches were also among the leading growth categories in May, reflecting the enduring strength in the adult-use and convenience categories.
Regionally, although Raleigh-Durham area posted the strongest sales growth, cities in the Upper Midwest led by Detroit and Chicago and Northeast including New York and Philadelphia, all posted solid gains.”
NRSInsights Reports
The NRSInsights monthly Retail Same-Store Sales Reports are intended to provide timely topline data reflective of sales at NRS’ network of independent, predominantly urban, retail stores.
Same-store data comparisons of May 2026 with May 2025 are derived from approximately 249 million transactions processed through the approximately 25,500 stores on the NRS network that scanned transactions in both months. Same-store data comparisons of May 2026 with April 2026 are derived from approximately 292 million transactions processed through approximately 33,300 stores.
Same-store data comparisons for the three months ended May 31, 2026 with the year-ago three months are derived from approximately 693 million transactions processed through stores that scanned transactions in both three-month periods.
NRS POS Platform
The NRS platform predominantly serves small-format, independent, retail stores nationwide including convenience stores, bodegas, liquor stores, grocers, and tobacco and sundries sellers. These independent retailers operate in all 50 states and the District of Colombia, including 206 of the 210 designated market areas (DMAs) in the United States, and in Canada. During May 2026, NRS’ POS terminals processed $2.4 billion in sales (+13% year-over-year) across 154 million transactions.
About National Retail Solutions (NRS):
National Retail Solutions operates a leading point-of-sale (POS) terminal-based platform and digital payment processing service for independent retailers nationwide. Retailers utilize NRS offerings to process transactions, effectively manage their businesses, and integrate with leading online order and delivery platforms. Consumer packaged goods (CPG) suppliers, brokers, analytics firms, and advertisers access the terminal’s digital display network to reach these retailers’ predominantly urban, multi-cultural shopper base, and to harness transaction data-based learnings to identify growth opportunities and measure both execution and returns on marketing investment. NRS is a subsidiary of IDT Corporation (NYSE: IDT).
All statements above that are not purely about historical facts, including, but not limited to, those in which we use the words “believe,” “anticipate,” “expect,” “plan,” “intend,” “estimate,” “target” and similar expressions, are forward-looking statements within the meaning of the Private Securities Litigation Reform Act of 1995. While these forward-looking statements represent our current judgment of what may happen in the future, actual results may differ materially from the results expressed or implied by these statements due to numerous important factors. Our filings with the SEC provide detailed information on such statements and risks, and should be consulted along with this release. To the extent permitted under applicable law, IDT assumes no obligation to update any forward-looking statements.
NRSInsights Contact:
Brandon Thurber VP, Data Sales & Client Success at NRS National Retail Solutions Brandon.Thurber@nrsplus.com
IDT Corporation Contact:
Bill Ulrey william.ulrey@idt.net
# # #
IDT Corporation to Report Third Quarter Fiscal Year 2026 Results
NEWARK, N.J., May 27, 2026 (GLOBE NEWSWIRE) — IDT Corporation (NYSE: IDT), a global provider of fintech and communications solutions, has scheduled its report of financial and operational results for the third quarter fiscal year 2026 (the three months ended April 30, 2026) on Wednesday, June 3, 2026.
IDT’s earnings release will be issued and posted on the IDT investor relations website (https://www.idt.net/investors-and–media) at approximately 4:30 PM Eastern.
IDT will host an earnings conference call beginning at 5:30 PM Eastern with management’s discussion of results followed by Q&A with investors. To listen to the call and participate in the Q&A, dial 1-877-545-0523 (toll-free from the US) or 1-973-528-0016 (international) and provide the following access code: 181062.
A replay of the conference call will be available approximately three hours after the call concludes through June 17th, 2026. To access the call replay, dial 1-877-481-4010 (toll-free from the US) or 1-919-882-2331 (international) and provide this replay passcode: 54085. The replay will also be accessible via streaming audio at the IDT investor relations website.
ABOUT IDT CORPORATION IDT Corporation (NYSE: IDT) is a global provider of fintech and communications solutions through a portfolio of synergistic businesses: National Retail Solutions‘ (NRS) point-of-sale (POS) platform enables independent retailers to process transactions and operate more effectively while providing advertisers and marketers with reach into underserved consumer markets; BOSS Money facilitates innovative international remittances and fintech payments solutions; net2phone provides businesses with unified communications and AI-driven workflow solutions to enhance customer experience at scale; IDT Digital Payments and the BOSS Revolution calling service make sharing prepaid products and services and speaking with friends and family around the world convenient and reliable; and, IDT Global and IDT Express enable communications services to provision and manage international voice and SMS messaging.
BOSS Money Digital Customers Send Record Remittances to Mom for Mother’s Day
Send Volume to Countries Celebrating Mother’s Day Jumps 49% Year-over-Year
NEWARK, N.J., May 12, 2026 (GLOBE NEWSWIRE) — BOSS Money, the international money remittance service of IDT Corporation (NYSE: IDT), today announced that its customers sent moms a record amount of principal and remittances using the BOSS Money and BOSS Revolution apps during the week leading up to and including Mother’s Day on May 10th, 2026.
For the week ended May 10th, 2026, BOSS Money digital customers sent 49% more principal via 27% more remittances than last year to the eight BOSS Money destination countries that celebrated Mother’s Day this past weekend, including Mexico, Guatemala, Honduras and El Salvador.
BOSS Money is a leading digital-first money remittance provider. 87% of all BOSS Money transfers during the week leading up to Mother’s Day were originated by customers using the trusted BOSS Money and BOSS Revolution apps.
“We are honored that so many new and returning customers entrusted BOSS Money to deliver their hard-earned money to mom this Mother’s Day,” said Michelle Rendo, BOSS Money’s VP of Marketing. “It is our privilege to help bring families closer together on mom’s special day.”
BOSS Money’s international remittance service provides affordable, reliable money transfers for residents of the U.S. to 50 popular destination countries in Latin America, the Caribbean, Africa, and South Asia.
In its most recent rankings, FXC Intelligence recognized BOSS Money as the top-rated money transfer app, with a near-perfect 4.9 rating. Across the Apple App Store and Google Play, BOSS Money has over 110,000 five-star reviews.
See a Spanish language sample of BOSS Money Mother’s Day campaign here.
Download the BOSS Money app on iOS or Android or visit bossmoney.com.
Stay connected and follow BOSS Money on Instagram, Facebook and TikTok @bossmoney.official.
*The rates of increase in principal and transactions for Mother’s Day 2026 compare the seven days leading up to and including Mother’s Day 2026 (May 4th to 10th) to the comparable week in 2025 (May 5th to 11th). For ‘destination countries that celebrated Mother’s Day,’ the rates of increase reflect transfers originated in the U.S. to the 8 destination countries served by BOSS Money that celebrated Mother’s Day during the weeks ended Sunday, May 10th, 2026, and Sunday, May 11th, 2025.
ABOUT BOSS MONEY BOSS Money’s rapidly expanding international remittance service provides fast, secure and reliable money transfers for residents of the U.S. to popular destination countries in Latin America, the Caribbean, Africa, and South Asia. BOSS Money offers a robust menu of payout options, including bank deposits, cash pick-up, mobile wallets, direct-to-debit, and home delivery. Customers can remit funds through the highly rated BOSS Money and BOSS Revolution apps, WhatsApp or through licensed BOSS Money retailers. BOSSMoney is the remittance and payments brand of IDT Corporation (NYSE: IDT).
ABOUT IDT CORPORATION IDT Corporation (NYSE: IDT) is a global provider of fintech and communications services through a portfolio of synergistic businesses: National Retail Solutions (NRS), through its point-of-sale (POS) platform, enables independent retailers to operate more effectively while providing advertisers and marketers with unprecedented reach into underserved consumer markets; net2phone provides enterprises and organizations with intelligently integrated cloud communications and contact center services across channels and devices; IDT’s fintech and neo-banking services include BOSS Money, a popular international remittance business, as well as other services that make saving, spending, and sharing money easy and secure; IDT Digital Payments and BOSS Revolution Calling make sharing prepaid products and services and speaking with friends and family around the world convenient and reliable; and, IDT Global and IDT Express enable communications services to provision and manage international voice and SMS messaging.
All statements above that are not purely about historical facts, including, but not limited to, those in which we use the words “believe,” “anticipate,” “expect,” “plan,” “intend,” “estimate,” “target” and similar expressions, are forward-looking statements within the meaning of the Private Securities Litigation Reform Act of 1995. While these forward-looking statements represent our current judgment of what may happen in the future, actual results may differ materially from the results expressed or implied by these statements due to numerous important factors. Our filings with the SEC provide detailed information on such statements and risks and should be consulted along with this release. To the extent permitted under applicable law, IDT assumes no obligation to update any forward-looking statements.
NRSInsights’ April 2026 Retail Same-Store Sales Report
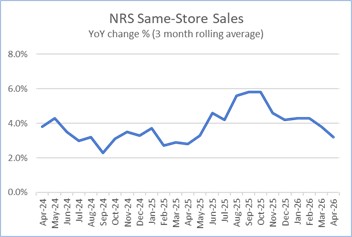
April same-store sales increased 3.9% year-over-year
The average price paid for the top 500 items in April increased 2.2% year-over-year
NEWARK, N.J., May 08, 2026 (GLOBE NEWSWIRE) — NRSInsights, a provider of sales data and analytics drawn from retail transactions processed through the National Retail Solutions (NRS) point-of-sale (POS) platform, today announced comparative retail same-store sales results for April 2026.
As of April 30, 2026, the NRS retail network comprised approximately 39,300 active terminals nationwide, scanning purchases at approximately 34,100 independent retailers, including convenience stores, bodegas, liquor stores, grocers, and tobacco and sundries sellers, predominantly serving urban consumers.
April Highlights
(Same-store sales, unit sales, transactions, and average price data refer to April 2026 and are compared to April 2025 unless otherwise noted. All comparisons are provided on a “per calendar day” basis to remove from consideration variability in the number of days per month or three-month period.)
SALES
Same-store sales increased 3.9% year-over-year. In the previous month (March 2026), same-store sales increased 2.9% year-over-year.
Same-store sales increased 1.7% compared to the previous month (March 2026). Same-store sales in March 2026 increased 4.3% compared to the previous month (February 2026).
For the three months ended April 30, 2026, same-store sales increased 3.2% compared to the corresponding three months a year ago.
UNITS SOLD
Units sold increased 0.5% year-over-year. In the previous month (March 2026), units sold decreased 1.2% year-over-year.
Units sold increased 1.3% compared to the previous month (March 2026). Units sold in March 2026 increased 4.0% compared to the previous month (February 2026).
BASKETS (TRANSACTIONS) PER STORE
Baskets decreased 0.3% year-over-year. In the previous month (March 2026), baskets decreased 0.4% year-over-year.
Baskets increased 2.9% compared to the previous month (March 2026). Baskets in March 2026 increased 6.5% compared to the previous month (February 2026).
AVERAGE PRICES
A dollar-weighted average of prices for the top 500 items purchased in April 2026 increased 2.2% year-over-year, more than the 1.4% year-over-year increase in March 2026.
Commentary from Brandon Thurber (VP, Data Sales & Client Success at NRS)
“Same-store sales accelerated in April, increasing 3.9% year-over-year compared to the 2.9% year-over-year growth recorded in March. The growth was powered by an increase in dollar sales per basket, which more than compensated for a slight decrease in transactions, continuing a long-term trend of increasing average per-visit spend.
“Turning to category performance, prepared cocktails and espresso experienced the strongest growth, and coconut water, sparkling water, and smokeless tobacco each posted strong double-digit gains. Rolling papers, frozen novelty, and wine-based cocktails also continued their steady climbs.
“Regionally, Raleigh Durham led the pack with a double-digit year-over-year sales increase while Los Angeles, Washington DC and Miami / Ft. Lauderdale all registered slight decreases.
“Our measure of inflation, reflecting the relative prices of the 500 top-selling products within our network, remained subdued at 2.2%.”
NRSInsights Reports
The NRSInsights monthly Retail Same-Store Sales Reports are intended to provide timely topline data reflective of sales at NRS’ network of independent, predominantly urban, retail stores.
Same-store data comparisons of April 2026 with April 2025 are derived from approximately 232 million transactions processed through the approximately 25,300 stores on the NRS network that scanned transactions in both months. Same-store data comparisons of April 2026 with March 2026 are derived from approximately 283 million transactions processed through approximately 33,000 stores.
Same-store data comparisons for the three months ended April 2026 with the year-ago three months are derived from approximately 643 million transactions processed through stores that scanned transactions in both three-month periods.
NRS POS Platform
The NRS platform predominantly serves small-format, independent, retail stores nationwide including convenience stores, bodegas, liquor stores, grocers, and tobacco and sundries sellers. These independent retailers operate in all 50 states and the District of Colombia, including 206 of the 210 designated market areas (DMAs) in the United States, and in Canada. During April 2026, NRS’ POS terminals processed $2.2 billion in sales (+13% year-over-year) across 145 million transactions.
About National Retail Solutions (NRS):
National Retail Solutions operates a leading point-of-sale (POS) terminal-based platform and digital payment processing service for independent retailers nationwide. Retailers utilize NRS offerings to process transactions, effectively manage their businesses, and integrate with leading online order and delivery platforms. Consumer packaged goods (CPG) suppliers, brokers, analytics firms, and advertisers access the terminal’s digital display network to reach these retailers’ predominantly urban, multi-cultural shopper base, and to harness transaction data-based learnings to identify growth opportunities and measure both execution and returns on marketing investment. NRS is a subsidiary of IDT Corporation (NYSE: IDT).
All statements above that are not purely about historical facts, including, but not limited to, those in which we use the words “believe,” “anticipate,” “expect,” “plan,” “intend,” “estimate,” “target” and similar expressions, are forward-looking statements within the meaning of the Private Securities Litigation Reform Act of 1995. While these forward-looking statements represent our current judgment of what may happen in the future, actual results may differ materially from the results expressed or implied by these statements due to numerous important factors. Our filings with the SEC provide detailed information on such statements and risks, and should be consulted along with this release. To the extent permitted under applicable law, IDT assumes no obligation to update any forward-looking statements.
NRSInsights Contact: Brandon Thurber VP, Data Sales & Client Success at NRS National Retail Solutions Brandon.Thurber@nrsplus.com
IDT Corporation Contact:
Bill Ulrey william.ulrey@idt.net
# # #
BOSS Money Makes it Easier to Honor Mom This Mother’s Day
Special offers help families celebrate Mom’s special day more affordably – no matter the distance
NEWARK, N.J., April 30, 2026 (GLOBE NEWSWIRE) — BOSS Money, the popular international remittance and payments service, today announced special Mother’s Day promotions available during the month of May, making it simpler and more affordable for families to be a part of Mother’s Day and support Mom – even when you cannot be by her side.
Mother’s Day is about more than celebration. It is about honoring the women who keep families strong and connected. This May, BOSS Money is helping both new and existing customers honor and celebrate Mom with limited-time offers.
New Customer Offer – May 1 through May 31 During May, new customers save $10 off the send amount of their first transfer when sending $100 or more to Mexico, Guatemala, Honduras, El Salvador, Colombia, the Dominican Republic, Peru, or Ecuador by applying the promotional code available in the BOSS Money app.
As always, new customers on the BOSS Money app enjoy $0-fees on their first 5 money transfers to Mexico and their first 3 transfers to all other destinations.
Existing Customer Offer – May 7 through May 10 From May 7th through May 10th – the days surrounding Mother’s Day – existing customers can send one transfer to any BOSS Money destination worldwide with $0-fees, by applying the promo code in the BOSS Money app.
“Millions of our customers are immigrants who sacrifice to provide for their families – making Mother’s Day one of the most significant sending occasions of the year,” said Michelle Rendo, Head of Marketing for BOSS Money. “We want to make it easier for families to stay connected and support the moments that matter the most.”
America’s Highest-Rated Money Transfer App
In its most recent rankings, FXC Intelligence recognized BOSS Money as the top-rated money transfer app, with a near-perfect 4.9 rating. Across the Apple App Store and Google Play, BOSS Money has over 110,000 five-star reviews.
Features that BOSS Money Customers Can Count On
Built to support families across borders, the BOSS Money app delivers fast, secure, and transparent international transfers to more than 50 destination countries worldwide, with features that make sending simple:
Transparent fee and exchange-rate previews before every transfer
Fast delivery – funds often arrive within minutes
Multiple payout options: bank deposits, cash pick-up, mobile wallets, direct-to-debit, and home delivery
Secure, encrypted transactions with fraud alerts, Face ID, and passcode protection
Real-time transfer tracking for senders and recipients
Bilingual customer support in English and Spanish
To show up for Mom and celebrate her this Mother’s Day, download the BOSS Money app on iOS or Android or visit bossmoney.com.
Stay connected and follow BOSS Money on Instagram, Facebook and TikTok @bossmoney.official.
ABOUT BOSS MONEY
BOSS Money’s rapidly expanding international remittance service provides fast, secure and reliable money transfers for residents of the U.S. to popular destination countries in Latin America, the Caribbean, Africa, and South Asia. BOSS Money offers a robust menu of payout options including bank deposits, cash pick-up, mobile wallets, direct-to-debit, and home delivery. Customers can remit funds through WhatsApp, the highly rated BOSS Money and BOSS Revolution apps, or through licensed Boss Money retailers. BOSS money is the remittance and payments brand of IDT Corporation (NYSE: IDT).
CONTACT
IDT Corporation Investor Relations Bill Ulrey william.ulrey@idt.net
# # #
net2phone Sync Launches in Canada
Purpose-built unified communications platform brings AI-powered conversations, enterprise-grade reliability, and Canadian data residency to Canadian businesses nationwide
OTTAWA, Ontario, April 14, 2026 (GLOBE NEWSWIRE) — net2phone, a global leader in cloud communications and AI-powered customer-engagement solutions, today announced the availability of net2phone Sync for Canadian businesses.
Built for businesses of all sizes across Canada, net2phone Sync is a powerful, unified business communications platform that integrates voice, video, and messaging in a single intuitive experience – enabling teams and administrators to manage every conversation from one place.
For Canadian businesses seeking to modernize their communications infrastructure and deliver more personalized customer experiences, net2phone Sync provides a turnkey path to the cloud without complexity or compromise. All cloud data is encrypted and securely stored in Canada, meeting the data residency requirements critical to Canadian enterprises.
“net2phone Sync gives Canadian businesses everything they need to enhance their communications and streamline their operations, including a single platform for voice, video, and messaging, strong AI capabilities that turn conversations into action, and the peace of mind of Canadian data residency,” said Jonah Fink, President of net2phone. “Because we designed and built the Sync platform entirely in-house, we can move quickly – continuously adapting features and integrating new AI capabilities to help our customers stay ahead.”
Smarter conversations, faster workflows net2phone Sync’s integrated AI capabilities – including voice and video call transcription, call and meeting summarization, and automated follow-ups – accelerate the handoff from conversation to action, reducing manual effort and keeping teams focused on what matters. Pre-built integrations with leading CRM platforms enable more informed, personalized interactions across every touchpoint.
Key net2phone Sync capabilities include:
Unified voice, video, and messaging in a single-pane-of-glass interface
AI-powered call and meeting transcription and summarization
Automated post-conversation workflows and follow-up generation
Native CRM integrations to enrich customer data and streamline processes
Intuitive administration tools for fast deployment and easy management
Secure encryption with all data hosted in Canada
To schedule a demo or learn more, visit net2phone.com/sync or contact 1-613-237-9329.
About net2phone: net2phone’s innovative AI-powered communications and task execution help businesses around the globe succeed through smarter conversations, automated workflows, and enhanced insight. net2phone’s commitment to delivering reliable and high-quality communications services has earned it a reputation as a leader in both innovation and growth. net2phone is a subsidiary of IDT Corporation (NYSE: IDT). To learn more, please visit net2phone.com or connect on LinkedIn.
About IDT Corporation: IDT Corporation (NYSE: IDT) is a global provider of fintech and communications solutions through a portfolio of synergistic businesses: National Retail Solutions’ (NRS) point-of-sale (POS) platform enables independent retailers to operate more effectively while providing advertisers and marketers with reach into underserved consumer markets; BOSS Money facilitates innovative international remittances and fintech payments solutions; net2phone provides businesses with unified communications, customer experience, and AI-driven workflow solutions; IDT Digital Payments and the BOSS Revolution calling service make sharing prepaid products and services and speaking with friends and family around the world convenient and reliable; and, IDT Global and IDT Express enable communications services to provision and manage international voice and SMS messaging.
net2phone Media Contact: Denise D’Arienzo VP of Marketing & Sales Operations Email: denise.darienzo@net2phone.com
NRSInsights’ March 2026 Retail Same-Store Sales Report
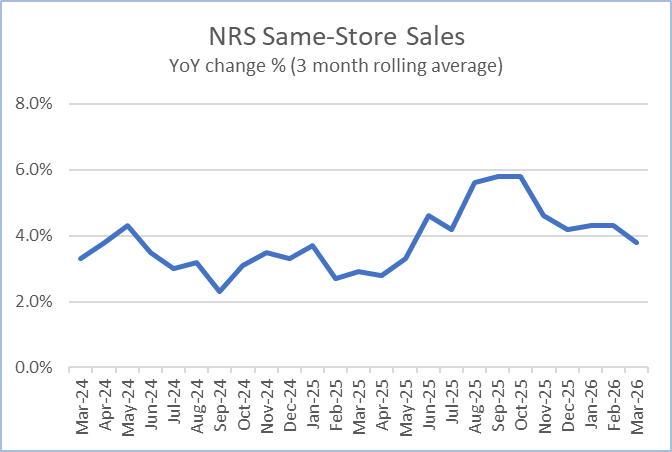
March same-store salesincreased 2.9% year-over-year
The average price paid for the top 500 items in March increased 1.4% year-over-year
NEWARK, N.J., April 06, 2026 (GLOBE NEWSWIRE) — NRSInsights, a provider of sales data and analytics drawn from retail transactions processed through the National Retail Solutions (NRS) point-of-sale (POS) platform, today announced comparative retail same-store sales results for March 2026.
As of March 31, 2026, the NRS retail network comprised approximately 39,100 active terminals nationwide, scanning purchases at approximately 33,800 independent retailers, including convenience stores, bodegas, liquor stores, grocers, and tobacco and sundries sellers, predominantly serving urban consumers.
March Highlights
(Same-store sales, unit sales, transactions, and average price data refer to March 2026 and are compared to March 2025 unless otherwise noted. All comparisons are provided on a “per calendar day” basis to remove from consideration variability in the number of days per month or three-month period.)
SALES
Same-store sales increased 2.9% year-over-year. In the previous month (February 2026), same-store sales increased 4.0% year-over-year.
Same-store sales increased 4.3% compared to the previous month (February 2026). Same-store sales in February 2026 increased 4.4% compared to the previous month (January 2026).
For the three months ended March 31, 2026, same-store sales increased 3.8% compared to the corresponding three months a year ago.
UNITS SOLD
Units sold decreased 1.2% year-over-year. In the previous month (February 2026), units sold decreased 0.2% year-over-year.
Units sold increased 4.0% compared to the previous month (February 2025). Units sold in February 2025 increased 2.1% compared to the previous month (January 2026).
BASKETS (TRANSACTIONS) PER STORE
Baskets decreased 0.4% year-over-year. In the previous month (February 2026), baskets decreased 0.8% year-over-year.
Baskets increased 6.5% compared to the previous month (February 2026). Baskets in February 2026 increased 3.7% compared to the previous month (January 2026).
AVERAGE PRICES
A dollar-weighted average of prices for the top 500 items purchased in March 2026 increased 1.4% year-over-year, less than the 2.7% year-over-year increase in February 2026.
Commentary from Brandon Thurber (VP, Data Sales & Client Success at NRS)
“March same-store sales increased 2.9% year-over-year, a decrease from the 4.0% growth rate recorded in February. Transactions and units both declined slightly compared to a year ago.
“Category performance painted a telling picture as the convenience store channel likely benefited from budget-conscious consumers who traded down from restaurant, bar and other on-premise food and beverage service.
“Prepared cocktails and packaged espresso each posted year-over-year gains north of 34% in March, while sparkling water, coconut water, and frozen novelty all grew more than 17%. Smokeless tobacco, energy beverages, and rolling papers also continued their steady climbs.
“Regionally, Raleigh-Durham stood out with 10% year-over-year dollar growth, and Boston and San Francisco each posted gains of 4.5% or more. New York – our largest market by store count – was essentially flat on dollars while transactions fell 3.3%. Miami and Houston both registered smaller decreases.
“Inflation eased, with the dollar-weighted average price for the top 500 items in March rising 1.4% year over year — down from 2.7% in February and the lowest rate of increase we have seen in nearly two years.
“As we head into the second quarter, recent trends, including the consecutive year-over-year decreases in transactions counts, the strong gains in certain ‘down-trading’ categories, and moderating price increases suggest that macro-economic uncertainty may have begun to weigh on discretionary spending.”
NRSInsights Reports
The NRSInsights monthly Retail Same-Store Sales Reports are intended to provide timely topline data reflective of sales at NRS’ network of independent, predominantly urban, retail stores.
Same-store data comparisons of March 2026 with March 2025 are derived from approximately 232 million transactions processed through the approximately 25,000 stores on the NRS network that scanned transactions in both months. Same-store data comparisons of March 2026 with February 2026 are derived from approximately 261 million transactions processed through approximately 32,700 stores.
Same-store data comparisons for the three months ended March 31, 2026 with the year-ago three months are derived from approximately 618 million transactions processed through those stores that scanned transactions in both three-month periods.
NRS POS Platform
The NRS platform predominantly serves small-format, independent, retail stores nationwide including convenience stores, bodegas, liquor stores, grocers, and tobacco and sundries sellers. These independent retailers operate in all 50 states and the District of Colombia, including 206 of the 210 designated market areas (DMAs) in the United States, and in Canada. During March 2026, NRS’ POS terminals processed $2.2 billion in sales (+8% year-over-year) across 145 million transactions.
About National Retail Solutions (NRS):
National Retail Solutions operates a leading point-of-sale (POS) terminal-based platform and digital payment processing service for independent retailers nationwide. Retailers utilize NRS offerings to process transactions, effectively manage their businesses, and integrate with leading online order and delivery platforms. Consumer packaged goods (CPG) suppliers, brokers, analytics firms, and advertisers access the terminal’s digital display network to reach these retailers’ predominantly urban, multi-cultural shopper base, and to harness transaction data-based learnings to identify growth opportunities and measure both execution and returns on marketing investment. NRS is a subsidiary of IDT Corporation (NYSE: IDT).
All statements above that are not purely about historical facts, including, but not limited to, those in which we use the words “believe,” “anticipate,” “expect,” “plan,” “intend,” “estimate,” “target” and similar expressions, are forward-looking statements within the meaning of the Private Securities Litigation Reform Act of 1995. While these forward-looking statements represent our current judgment of what may happen in the future, actual results may differ materially from the results expressed or implied by these statements due to numerous important factors. Our filings with the SEC provide detailed information on such statements and risks, and should be consulted along with this release. To the extent permitted under applicable law, IDT assumes no obligation to update any forward-looking statements.
NRSInsights Contact: Brandon Thurber VP, Data Sales & Client Success at NRS National Retail Solutions Brandon.Thurber@nrsplus.com
IDT Corporation to Present at Sidoti Investor Conference
NEWARK, N.J., March 17, 2026 (GLOBE NEWSWIRE) — IDT Corporation (NYSE: IDT), a global provider of fintech and communications solutions, will present at the Sidoti Virtual Investor Conference. The conference will be held on March 18th and 19th, 2026.
Marcelo Fischer, IDT’s Chief Financial Officer, and Bill Ulrey, VP Investor Relations, will provide an overview of the company’s operations, strategy, and financial results (through the second quarter of IDT’s fiscal year 2026) from 11:30 AM until 12:00 PM Eastern Time on Wednesday, March 18th. Mr. Fischer will also host one-on-one investor meetings during the conference.
All statements above that are not purely about historical facts, including, but not limited to, those in which we use the words “believe,” “anticipate,” “expect,” “plan,” “intend,” “estimate,” “target” and similar expressions, are forward-looking statements within the meaning of the Private Securities Litigation Reform Act of 1995. While these forward-looking statements represent our current judgment of what may happen in the future, actual results may differ materially from the results expressed or implied by these statements due to numerous important factors. Our filings with the SEC provide detailed information on such statements and risks, and should be consulted along with this release. To the extent permitted under applicable law, IDT assumes no obligation to update any forward-looking statements.
ABOUT IDT CORPORATION IDT Corporation (NYSE: IDT) is a global provider of fintech and communications solutions through a portfolio of synergistic businesses: National Retail Solutions‘ (NRS) point-of-sale (POS) platform enables independent retailers to operate more effectively while providing advertisers and marketers with reach into underserved consumer markets; BOSS Money facilitates innovative international remittances and fintech payments solutions; net2phone provides businesses with unified communications, customer experience, and AI-driven workflow solutions; IDT Digital Payments and the BOSS Revolution calling service make sharing prepaid products and services and speaking with friends and family around the world convenient and reliable; and, IDT Global and IDT Express enable communications services to provision and manage international voice and SMS messaging.